Space Station Appearing Nationwide Over July 4 Weekend

As America celebrates its 233rd birthday this holiday weekend, there will be an extra light in the sky along with the fireworks. Across the country, Americans will be treated to spectacular views of the International Space Station as it orbits 220 miles above Earth.

Many locations will have unusually long sighting opportunities of as much as five minutes, weather permitting, as the station flies almost directly overhead.

To find out when to see the station from your city, visit:

http://spaceflight.nasa.gov/realdata/sightings

The largest spacecraft ever built, the station also is the most reflective. It will be brighter than most stars at dawn and dusk, appearing as a solid, glowing light, slowly traversing the predawn or evening sky. It is visible when lit by the sun while the ground below is not in full daylight. It moves across the sky too fast for conventional telescopes, but a good set of binoculars can enhance the viewing experience, even revealing some detail of the station's structure.

The station circles Earth every 90 minutes. It is 357 feet long, about the length of a football field including the end zones, and 45 feet tall. Its reflective solar arrays are 240 feet wide, a wingspan greater than that of a jumbo jet, and have a total surface area of more than 38,000 square feet.

An international crew of six astronauts, including American flight engineer Michael Barratt, is aboard the complex conducting research and continuing its assembly. Other crew members are from Russia, Europe, Canada and Japan.

For more information about the station, visit:

http://www.nasa.gov/station

NASA TV to Broadcast Space Station Crew's Move of Return Craft

Three members of the International Space Station crew will board a Soyuz spacecraft attached to the station and move it to a different docking port on Thursday, July 2. The journey will be broadcast live on NASA Television.

Expedition 20 Commander Gennady Padalka and Flight Engineers Mike Barratt of NASA and Koichi Wakata of the Japan Aerospace Exploration Agency will undock the Soyuz TMA-14 return spacecraft, from the Zvezda service module and fly a short distance to the Pirs docking compartment. The flight is expected to take about 30 minutes.

NASA TV coverage will begin at 4 p.m. CDT with undocking planned for 4:26 p.m.

While Padalka, Barratt and Wakata are aboard the Soyuz, Expedition 20 Flight Engineers Roman Romanenko of Russia, Bob Thirsk of the Canadian Space Agency and Frank De Winne of the European Space Agency will monitor the move from inside the station. Their Soyuz return craft, the TMA-15, is docked to the Earth-facing port of the station's Zarya module.

The relocation of Soyuz TMA-14 opens the Zvezda docking port for the arrival of a new Russian Progress cargo vehicle in late July.

For information about the International Space Station, visit:

http://www.nasa.gov/station

For information about NASA TV streaming video, downlink and schedule information, visit:

http://www.nasa.gov/ntv

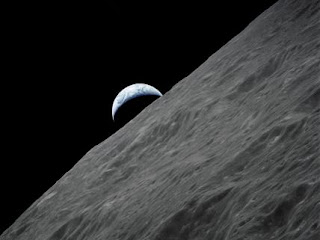
Crescent Earth

Crescent EarthThe crescent Earth rises above the lunar horizon in this spectacular photograph taken from the Apollo 17 spacecraft in lunar orbit during final lunar landing mission in the Apollo program.

Ulysses Spacecraft Ends Historic Mission of Discovery

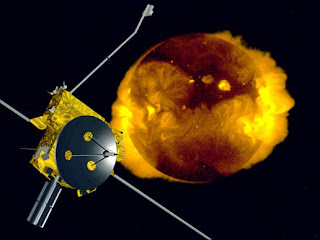
Ulysses team members bid the spacecraft a fond farewell.Artist's concept of Ulysses.
Ulysses, a joint NASA and European Space Agency mission, officially ceased operations today, after receiving commands from ground controllers to do so. The spacecraft, which operated for more than 18 years, charted the unexplored regions of space above the poles of the sun.

As planned via commands beamed to the spacecraft earlier in the day, Ulysses switched to its low-gain antenna at 1:09 p.m. PDT (4:09 p.m. EDT, or 2009 UTC). As a result, ground controllers were no longer able to pick up a signal from Ulysses, which had also been commanded to switch off its transmitter completely at 1:15 p.m. PDT (4:15 p.m. EDT, or 2015 UTC).

When space shuttle Discovery launched Ulysses on Oct. 6, 1990, it had an expected lifetime of five years. The mission gathered unique information about the heliosphere, the bubble in space carved by the solar wind, for nearly four times longer than expected.

"This has been a remarkable scientific endeavor," said Richard Marsden, Ulysses mission manager and project scientist at the European Space Agency. "The results Ulysses obtained have exceeded our wildest dreams many times over."

Ulysses made nearly three complete orbits of the sun. The probe revealed for the first time the three-dimensional character of galactic cosmic radiation, energetic particles produced in solar storms and the solar wind. Not only has Ulysses allowed scientists to map constituents of the heliosphere in space, its longevity enabled them to observe the sun over a longer period of time than ever before.

"The sun's activity varies with an 11-year cycle, and now we have measurements covering almost two complete cycles," said Marsden. "This long observation has led to one of the mission's key discoveries, namely that the solar wind has grown progressively weaker during the mission and is currently at its weakest since the start of the Space Age."

In addition to measuring the solar wind and charged particles, Ulysses instruments measured small dust particles and neutral gases from local interstellar space that penetrate into the heliosphere. Ulysses had an unprecedented three chance encounters with comet tails, registered more than 1,800 cosmic gamma-ray bursts, and provided findings for more than 1,000 scientific articles and two books.

"The breadth of science addressed by Ulysses is truly astonishing," said Ed Smith, Ulysses project scientist at NASA's Jet Propulsion Laboratory in Pasadena, Calif. "The data acquired during the long lifetime of this mission have provided an unprecedented view of the solar activity cycle and its consequences and will continue to keep scientists busy for many years to come."

Ulysses' successes have not been confined to scientific data. The extended mission presented significant challenges to the NASA-European operations team. In particular, critical parts of the spacecraft became progressively colder with time. In recent years, a major effort was needed to prevent the onboard hydrazine fuel from freezing. The operations team continually created methods to allow the aging space probe to continue its scientific mission.

Earlier this month, the Ulysses mission team received a NASA Group Achievement Award. Another milestone was reached on June 10 when Ulysses became the longest-running ESA-operated spacecraft, overtaking the International Ultraviolet Explorer which logged 18 years and 246 days of operations.

"The Ulysses team performed exceptionally by building and operating a research probe that would return scientific data for analysis no matter what challenges it encountered," said Arik Posner, Ulysses program scientist at NASA Headquarters in Washington. "The knowledge gained from Ulysses proves what can be achieved through international cooperation in space research."

The Ulysses orbital path is carrying the spacecraft away from Earth. The ever-widening gap has progressively limited the amount of data transmitted. Ulysses project managers, with the concurrence of ESA and NASA, decided it was an appropriate time to end this epic scientific adventure.

ESA Ulysses Mission Operations Manager Nigel Angold points out that more than a year ago, "We had estimated Ulysses would not survive further than July 2008. However, the spacecraft didn't stop surprising us and kept working a full year, collecting invaluable science data. It's nice to be going out in style."

After the spacecraft was placed into low Earth orbit in 1990, a combination of solid fuel motors propelled Ulysses toward Jupiter. Ulysses swung by Jupiter on Feb. 8, 1992. The giant planet's gravity bent the spacecraft's flight path southward and away from the ecliptic plane, putting the probe into a final orbit that would take it over the sun's south and north poles.

The European Space Agency's European Space Research and Technology Centre and European Space Operations Centre managed the mission in coordination with the Jet Propulsion Laboratory. Ulysses is tracked by NASA's Deep Space Network. A joint ESA/NASA team at JPL oversaw spacecraft operations and data management. Teams from universities and research institutes in Europe and the United States provided the 10 instruments on board.

More information about the mission is available at http://ulysses.jpl.nasa.gov .

Five Years Ago, Cassini Began Orbiting Saturn

NASA's Cassini mission has been orbiting Saturn for five Earth years as of June 30, 2009. That's about one sixth of a Saturnian year, enough time for the spacecraft to have observed seasonal changes in the planet, its moons and sunlight's angle on the dramatic rings.

Cassini passed through a gap in the rings as it entered orbit on June 30, 2004. It finished its prime mission in 2008 and continues to use its 12 instruments in an extended mission that includes extensive further studies of the moons Titan and Enceladus.

Cassini's view of Saturn.Saturn … Four Years On

As Saturn advances in its orbit toward equinox and the sun gradually moves northward on the planet, the motion of Saturn's ring shadows and the changing colors of its atmosphere continue to transform the face of Saturn as seen by Cassini.

This captivating natural color view was created from images collected shortly after Cassini began its extended Equinox Mission in July 2008. It can be contrasted with earlier images from the spacecraft's four-year prime mission that show the shadow of Saturn's rings first draped high over the planet's northern hemisphere, then shifting southward as northern summer changed to spring (see PIA06606 and PIA09793). During this time, the colors of the northern hemisphere have evolved from azure blue to a multitude of muted-colored bands.

This mosaic combines 30 images -- 10 each of red, green and blue light -- taken over the course of approximately two hours as Cassini panned its wide-angle camera across the entire planet and ring system on July 23, 2008, from a southerly elevation of 6 degrees.

Six moons complete this constructed panorama: Titan (5,150 kilometers, or 3,200 miles, across), Janus (179 kilometers, or 111 miles, across), Mimas (396 kilometers, or 246 miles, across), Pandora (81 kilometers, or 50 miles, across), Epimetheus (113 kilometers, or 70 miles, across) and Enceladus (504 kilometers, or 313 miles, across).

NASA’s Cassini spacecraft captured these images at a distance of approximately 1.1 million kilometers (690,000 miles) from Saturn and at a sun-Saturn-spacecraft, or phase, angle of 20 degrees. Image scale is 70 kilometers (43.6 miles) per pixel.

The Cassini-Huygens mission is a cooperative project of NASA, the European Space Agency and the Italian Space Agency. The Jet Propulsion Laboratory, a division of the California Institute of Technology in Pasadena, manages the mission for NASA's Science Mission Directorate, Washington, D.C. The Cassini orbiter and its two onboard cameras were designed, developed and assembled at JPL. The imaging operations center is based at the Space Science Institute in Boulder, Colo.

For more information about the Cassini-Huygens mission visit http://saturn.jpl.nasa.gov . The Cassini imaging team homepage is at http://ciclops.org .

Predicting the Weather

Predicting the WeatherA United Launch Alliance Delta IV with the NASA/NOAA Geostationary Operational Environmental Satellite-O launched on June 27, 2009, from Space Launch Complex-37, Cape Canaveral Air Force Station, Fla. GOES-O will provide more accurate prediction and tracking of severe storms and other weather phenomena, resulting in earlier and more precise warnings to the public.

NASA, Japan Release Most Complete Topographic Map of Earth

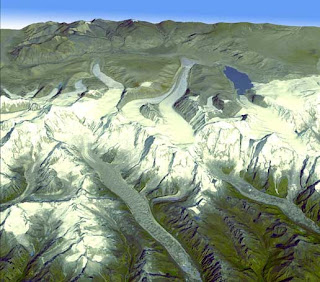
Himalayan glaciers in Bhutan
Los Angeles Basin image
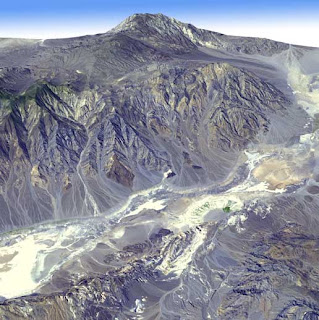
Death Valley
Global MapNASA and Japan released a new digital topographic map of Earth Monday that covers more of our planet than ever before. The map was produced with detailed measurements from NASA's Terra spacecraft.

The new global digital elevation model of Earth was created from nearly 1.3 million individual stereo-pair images collected by the Japanese Advanced Spaceborne Thermal Emission and Reflection Radiometer, or Aster, instrument aboard Terra. NASA and Japan's Ministry of Economy, Trade and Industry, known as METI, developed the data set. It is available online to users everywhere at no cost.

"This is the most complete, consistent global digital elevation data yet made available to the world," said Woody Turner, Aster program scientist at NASA Headquarters in Washington. "This unique global set of data will serve users and researchers from a wide array of disciplines that need elevation and terrain information."

According to Mike Abrams, Aster science team leader at NASA's Jet Propulsion Laboratory in Pasadena, Calif., the new topographic information will be of value throughout the Earth sciences and has many practical applications. "Aster's accurate topographic data will be used for engineering, energy exploration, conserving natural resources, environmental management, public works design, firefighting, recreation, geology and city planning, to name just a few areas," Abrams said.

Previously, the most complete topographic set of data publicly available was from NASA's Shuttle Radar Topography Mission. That mission mapped 80 percent of Earth's landmass, between 60 degrees north latitude and 57 degrees south. The new Aster data expand coverage to 99 percent, from 83 degrees north latitude and 83 degrees south. Each elevation measurement point in the new data is 30 meters (98 feet) apart.

"The Aster data fill in many of the voids in the shuttle mission's data, such as in very steep terrains and in some deserts," said Michael Kobrick, Shuttle Radar Topography Mission project scientist at JPL. "NASA is working to combine the Aster data with that of the Shuttle Radar Topography Mission and other sources to produce an even better global topographic map."

NASA and METI are jointly contributing the Aster topographic data to the Group on Earth Observations, an international partnership headquartered at the World Meteorological Organization in Geneva, Switzerland, for use in its Global Earth Observation System of Systems. This "system of systems" is a collaborative, international effort to share and integrate Earth observation data from many different instruments and systems to help monitor and forecast global environmental changes.

NASA, METI and the U.S. Geological Survey validated the data, with support from the U.S. National Geospatial-Intelligence Agency and other collaborators. The data will be distributed by NASA's Land Processes Distributed Active Archive Center at the U.S. Geological Survey's Earth Resources Observation and Science Data Center in Sioux Falls, S.D., and by METI's Earth Remote Sensing Data Analysis Center in Tokyo.

Aster is one of five Earth-observing instruments launched on Terra in December 1999. Aster acquires images from the visible to the thermal infrared wavelength region, with spatial resolutions ranging from about 15 to 90 meters (50 to 300 feet). A joint science team from the U.S. and Japan validates and calibrates the instrument and data products. The U.S. science team is located at JPL.

For visualizations of the new Aster topographic data, visit: http://www.nasa.gov/topics/earth/features/20090629.html .

Data users can download the Aster global digital elevation model at: https://wist.echo.nasa.gov/~wist/api/imswelcome and http://www.gdem.aster.ersdac.or.jp .

For more information about NASA and agency programs, visit: http://www.nasa.gov .

NASA Debuts the Entire 2008 Hurricane Season in New On-line Video

NOAA's official map of tropical cyclone tracks during the Atlantic Ocean season 2008.Imagine watching all of the tropical depressions, storms and hurricanes of 2008 as they formed in the Atlantic Ocean Basin and either faded at sea or made landfall. Thanks to NASA technology and satellite data coupled with data from a National Oceanic and Atmospheric Administration (NOAA) operated satellite, you can see the tracks of storms from Arthur to Paloma from birth to death.

There were 17 tropical cyclones in the Atlantic Hurricane Season, which includes the North Atlantic Ocean, Caribbean Sea and Gulf of Mexico. Sixteen of the storms were strong enough to be named, and only one stayed a tropical depression.

The movie displays the infrared cloud imagery from the geosynchronous weather satellites, principally NOAA's Geostationary Operational Environmental Satellite (GOES)-12. The original cloud imagery was remapped and enhanced to display cloudtop texture. The GOES cloud images were overlaid on a true-color background map previously created from the Moderate Imaging Spectroradiometer (MODIS) instrument on NASA's Terra satellite.

The movie, which can be found on NASA's Hurricane Web page (www.nasa.gov/hurricane), or on the NASA GOES web page, is television production-quality. "These are large, high-resolution, colorful animations, made for use or editing by professional documentary producers or for anyone interested in hurricanes," said Dr. Dennis Chesters, GOES Project Scientist at the Laboratory for Atmospheres at NASA's Goddard Space Flight Center, Greenbelt, Md.

The movie depicts the entire 2008 hurricane season based on six months of GOES imagery at 30 minute intervals from May 1 to November 18, 2008. Each "frame" has a date and time stamp with the times in Universal Coordinated Time (UTC). There are 2 versions of the movie available: a 720p and 1080p HD-TV digital animation.

There's also a "highlights" movie that features the middle of the hurricane season from July 2 to September 14. The shortened "Highlights" movie from Bertha to Ike, July 2-Sept. 14 can be found here -- > Highlights

"Most versions are overlaid with hurricane names and storm tracks, with the tracks represented by dots whose size and color represent NOAA's hurricane Category 1 to 5 (on the Saffir-Simpson Scale)," Dr. Chesters said. "Some movies have captions summarizing each storm in a sidebar. Movies without named tracks are useful for forecasters and researchers who want to see the regional meteorology without visual distractions."

All of the movies in various formats labeled or unlabeled, large or small, are also on-line and downloadable at the GOES page for "Hurricane Alley 2008"
> Hurricane Alley

The NASA GOES Project office plans to make a movie of the 2009 season.

Related Links:

> Entire 2008 Hurricane Season, High Resolution
> Entire 2008 Hurricane Season, Low Resolution

Astronaut Candidates

NASA Selects New Astronauts for Future Space Exploration

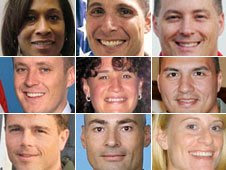
NASA Selects New Astronauts for Future Space ExplorationAfter reviewing more than 3500 applications, NASA has selected nine men and women for the 2009 astronaut candidate class. They will begin training at NASA’s Johnson Space Center, Houston, in August.

“This is a very talented and diverse group we've selected,” said Bill Gerstenmaier, NASA associate administrator for Space Operations. “They will join our current astronauts and play very important roles for NASA in the future. In addition to flying in space, astronauts participate in every aspect of human spaceflight, sharing their expertise with engineers and managers across the country. We look forward to working with them as we transcend from the shuttle to our future exploration of space, and continue the important engineering and scientific discoveries aboard the International Space Station."

The new astronaut candidates:

Serena M. Aunon, 33, of League City, Texas; University of Texas Medical Branch-Wyle flight surgeon for NASA’s Space Shuttle, International Space Station and Constellation Programs; born in Indianapolis, Ind. Aunon holds degrees from The George Washington University, University of Texas Health Sciences Center in Houston, and UTMB.

Jeanette J. Epps, 38, of Fairfax, Va.; technical intelligence officer with the Central Intelligence Agency; born in Syracuse, N.Y. Epps holds degrees from LeMoyne College and the University of Maryland.

Jack D. Fischer, Major U.S. Air Force, 35, of Reston, Va.; test pilot; U.S. Air Force Strategic Policy intern (Joint Chiefs of Staff) at the Pentagon; born in Boulder, Colo. Fischer is a graduate of the U.S. Air Force Academy and Massachusetts Institute of Technology.

Michael S. Hopkins, Lt. Colonel U.S. Air Force, 40, of Alexandria, Va.; special assistant to the Vice Chairman (Joint Chiefs of Staff) at the Pentagon; born in Lebanon, Mo. Hopkins holds degrees from the University of Illinois and Stanford University.

Kjell N. Lindgren, 36, of League City, Texas; University of Texas Medical Branch-Wyle flight surgeon for NASA’s Space Shuttle, International Space Station and Constellation Programs; born in Taipei, Taiwan. Lindgren has degrees from the U.S. Air Force Academy, Colorado State University, University of Colorado, the University of Minnesota, and UTMB.

Kathleen (Kate) Rubins, 30, of Cambridge, Mass.; born in Farmington, Conn.; principal investigator and fellow, Whitehead Institute for Biomedical Research at MIT and conducts research trips to the Congo. Rubins has degrees from the University of California-San Diego and Stanford University.

Scott D. Tingle, Commander U.S. Navy, 43, of Hollywood, Md.; born in Attleboro, Mass.; test pilot and Assistant Program Manager-Systems Engineering at Naval Air Station Patuxent River. Tingle holds degrees from Southeastern Massachusetts University (now University of Massachusetts Dartmouth) and Purdue University.

Mark T. Vande Hei, Lt. Colonel U.S. Army, 42, of El Lago, Texas; born in Falls Church, Va.; flight controller for the International Space Station at NASA’s Johnson Space Center, as part of U.S. Army NASA Detachment. Vande Hei is a graduate of Saint John’s University and Stanford University.

Gregory R. (Reid) Wiseman, Lt. Commander U.S. Navy, 33, of Virginia Beach, Va.; born in Baltimore; test pilot; Department Head, Strike Fighter Squadron 103, USS Dwight D. Eisenhower, based out of Oceana Virginia. Wiseman is a graduate of Rensselaer Polytechnic Institute and Johns Hopkins University.

NASA Television’s Video File will include b-roll of astronaut training. For NASA TV streaming video, schedules and downlink information, visit:

http://www.nasa.gov/ntv

For more information about the International Space Station, visit:

http://ww.nasa.gov/station

For more information about astronaut selection and training, visit:

http://nasajobs.nasa.gov/astronauts/

GOES-O Separates from Second Stage to Begin Mission

The GOES-O weather satellite is on its own following a successful separation from the Delta IV second stage. The separation occurred soon after the second stage performed the final of three burns to place the GOES-O spacecraft in a transfer orbit that will eventually reach about 22,300 miles above Earth. The satellite will be checked out through a series of tests in coming weeks. The GOES-O launched from Cape Canaveral Air Force Station, Fla., at 6:51 p.m. EDT aboard a Delta IV rocket.‬

GOES-O Reaches Orbit
GOES-O launches aboard a Delta IV rocket
The GOES-O satellite lifted off from Launch Complex 37 at Cape Canaveral Air Force Station in Florida at 6:51 p.m. EDT atop a Delta IV rocket. From a position about 22,300 miles above Earth, the advanced weather satellite will keep an unblinking eye on atmospheric conditions in the Eastern United States and Atlantic Ocean.

Mission Overview
GOES-O is the latest weather satellite developed by NASA to aid the nation's meteorologists and climate scientists. The acronym stands for Geostationary Operational Environmental Satellite. The spacecraft in the series provide the familiar weather pictures seen on United States television newscasts every day. The satellites are equipped with a formidable array of sensors and instruments.

GOES provides nearly continuous imaging and sounding, which allows forecasters to better measure changes in atmospheric temperature and moisture distributions, hence increasing the accuracy of their forecasts. GOES environmental information is used for a host of applications, including weather monitoring and prediction models.

› View GOES Lithograph
› View GOES Lithograph Back

NASA Engineer Helps Comedian Tackle Fear of Flying

Langley aerospace engineer Anna McGowan and NASA 360 co-host Johnny Alonso (R) spoke with Malkoff (L) at the Newport News - Williamsburg International AirportComedian Mark Malkoff is spending the entire month living on AirTran airliners to try to overcome his fear of flying.Survey any number of airline passengers and you may not hear the most positive reaction to air travel these days. Seats are cramped. Planes are crowded. And don't even get anybody started on delays, security procedures or extra costs. So what would possess anyone to live on an airplane for a month and endure 30 days of conditions many people would prefer to avoid?

Meet Mark Malkoff.

The 33-year-old comedian/writer/filmmaker is staying on an AirTran airplane the entire month of June and sharing his experiences with the public via the web. According to his website, markonairtran.com, "Although I'll switch planes, I'll never set foot in an airport. I'll change flights by way of the tarmac."

How does somebody keep busy on a plane for an entire month? Malkoff's videos show he's already memorized the SkyMall catalogue, played Twister and called Bingo over the airplane microphone. But he's also been meeting new people, including aerospace engineer Anna McGowan from NASA's Langley Research Center in Hampton, Va.

McGowan visited with Malkoff at the nearby Newport News - Williamsburg Airport to help him learn more about flying and especially about the research NASA is doing to make more it efficient and environmentally friendly.

"We're developing technologies for the next generation of flight," said McGowan. "We're working on engines that have a much lower fuel consumption. We're also reducing the weight of airplanes using innovative materials that are lighter weight but stronger than they are today."

Malkoff started his journey "to get over my fear of flying. I've struggled with the fear for years." He says flying has definitely gotten easier. "If the fear started at a 10 ... it's now about a two," he said.

But even after flying 197 hours and 82,000 miles (approx. 132,000 km), Malkoff still had questions about why planes do some of the things they do. He asked McGowan why planes have to bank or fly at a "tilt".

"The pilot is trying very carefully to make a smooth one-G turn, so that your glasses aren't sliding off the edge of your tray and so that everybody stays level in the airplane," said McGowan. "He wants to avoid side slip."

Joining McGowan at the airport was Johnny Alonso, one of the hosts of "NASA 360," a half hour NASA TV program that explores NASA's contributions to everyday life. NASA 360 and a crew that follows Malkoff both videotaped the conversation for future shows.

Satellites Guide Relief to Earthquake Victims

Formosat-2 satelliteOn May 28 at 2:24 a.m. local time, a deadly earthquake rocked Honduras, killing seven people and injuring several others, demolishing homes, damaging scores of other buildings, and sending terrified residents running through the streets.

"I woke up immediately, and all I could do was hug my youngest son and pray," says Dalia Martinez of San Pedro Sula, Honduras. "After a few minutes, my family and I went outside, where my neighbors were already gathered, likewise terrified about what happened but grateful we were all okay. Since then, we’ve been sleeping with flashlights and telephones within reach, because the aftershocks have been strong."

Fortunately for Martinez and other shaken residents, disaster officials knew exactly where to send help. A state-of-the-art Earth observation system called SERVIR directed them to the hardest hit areas.

Meaning "to serve" in Spanish, SERVIR is a joint effort of NASA, CATHALAC, the U.S. Agency for International Development, the Regional Center for the Mapping of Resources for Development, and other partners. The system uses satellite imagery to zero in on places where a flood, fire, hurricane, or earthquake has left destruction in its wake. Team members combine satellite data with ground observations, and display (for all to view) a near real-time map of crisis points. At a glance, decisions-makers can see the locations of most severe damage so they can send help in a hurry.

"The Honduras earthquake was a perfect example of SERVIR at its best," says Emil Cherrington, Senior Scientist at SERVIR's regional operational facility at CATHALAC in Panama. "It was like a chain reaction. People from agencies and organizations in several countries worked together after the earthquake to pinpoint precise locations where support was needed."

Breaking news stories revealed that the worst infrastructural damage was restricted, in general, to Honduras and Belize, so the SERVIR team at CATHALAC began to assemble baseline imagery and data for a bird’s eye view of those areas. They contacted Stuart Frye of NASA's Goddard Space Flight Center and asked him to arrange satellite imagery.

The next day, Frye notified the team that the Taiwanese would image the hardest hit areas by using their Formosat-2 satellite. In fact, the Taiwanese were already in action.

Dr. Cheng-Chien Liu of the National Cheng-Kung University of Taiwan explains: "President Ma Ying-Jeou of Taiwan and his delegation were visiting Belize the night earthquake struck. As news of the quake spread across the Pacific, all Taiwanese were shocked and very anxious to confirm their safety and that of the people who lived in the countries hit."

"We knew the fastest way to capture images of the disaster area would be to use Formosat-2. So I issued an urgent request for assistance to Dr. An-Ming Wu, the Deputy General Director of National Space Organization. Even though it was the Dragon Boat holiday and all Taiwanese were enjoying their family reunion, Dr. Wu called the Formosat-2 mission operation team to rush back to the control center. The three critical images were taken in record time!"

Dan Irwin, SERVIR Project Director at NASA's Marshall Space Flight Center, recalls the lightning-fast response: "I was in a bus in Berlin when I received an email from Dr. Liu telling me they had the images ready to send. It was early Saturday morning in Panama, but I called and woke Emil [Cherrington] up anyway to let him know."

"Dr. Liu was the one who lost sleep," says Cherrington. "He stayed up until 2 a.m. Taiwan time sending the images to our servers at CATHALAC. The data volume was huge, so the transfer was slow, but he wouldn't go home until he was sure we received all the images."

Herschel Opens Its Infrared Eyes

Glowing light from clouds of dust and gas around and between the stars is visible clearly.The Herschel Space Observatory has snapped its first picture since blasting into space on May 14, 2009. The mission, led by the European Space Agency with important participation from NASA, will use infrared light to explore our cosmic roots, addressing questions of how stars and galaxies are born.

The new "sneak preview" image was taken in an early attempt to demonstrate that Herschel works, and, in particular, that its telescope is focused and correctly aligned with the science instruments, and to whet our appetites for what's yet to come. It shows the Whirlpool galaxy, which lies relatively nearby, about 35 million light-years away, in the constellation Canes Venatici.

The galaxy was first observed by Charles Messier in 1773, who gave the beauty its official name of Messier 51. Back then, astronomers, including William Herschel, the observatory's namesake, catalogued objects like these as fuzzy nebulae without knowing their true nature. Later, Messier 51 became one of the first of these fuzzy objects observed to have a spiral structure, a finding that eventually led to the revelation that galaxies full of stars exist far from our own.

The image is a composite of infrared light captured with Herschel's Photoconductor Array Camera and Spectrometer at three wavelengths: 70, 100 and 160 microns. Herschel's full wavelength range spans 55 to 672 microns. The blue and white areas show where stars are actively forming, while the brown regions contain cold dust. The brightest blue dot at top left is a smaller, companion galaxy.

Longer-wavelength light inherently does not produce pictures with resolution as high as those obtained at shorter wavelengths, such as visible light. However, because Herschel's mirror is the largest infrared astronomy mirror ever launched in space (3.5 meters, or about 11.5 feet across), it can take the sharpest pictures to date at the particular wavelengths it observes.

During its prime mission phase, NASA's Spitzer Space Telescope, also a space-based infrared telescope, could see shorter-wavelength light, with wavelengths ranging from 3.6 to 160 microns. Because the two telescopes are able to see, for the most part, different wavelengths of light, their results complement each other, highlighting the multifaceted features of cosmic objects. Spitzer's shorter-wavelength infrared view of the Whirlpool galaxy, in comparison to a visible-light view, can be seen at http://gallery.spitzer.caltech.edu/Imagegallery/image.php?image_name=ssc2004-19a .

Herschel is in the final stretches of its journey to the second Lagrange point of the Earth-sun system. The observatory will spend its lifetime, estimated to be at least three-and-a-half-years, orbiting this point, which is about 1.5 million kilometers (930,000 miles) from Earth on the opposite side of our planet from the sun. After a cover protecting the telescope's instruments was popped open on June 14, engineers and scientists commanded the telescope to take its first test picture. The telescope is still being commissioned, with science observations expected to begin later this year.

Herschel is a European Space Agency cornerstone mission, with science instruments provided by a consortia of European institutes and with important participation by NASA. NASA's Herschel Project Office is based at NASA's Jet Propulsion Laboratory. JPL contributed mission-enabling technology for two of Herschel's three science instruments. The NASA Herschel Science Center, part of the Infrared Processing and Analysis Center at the California Institute of Technology in Pasadena, supports the United States astronomical community. Caltech manages JPL for NASA. More information is online at http://www.herschel.caltech.edu .

The NASA Herschel Science Center is part of the consortium that developed the Photoconductor Array Camera and Spectrometer.

Ulysses Hears the Siren's Song

UlyssesUlysses, a joint NASA and European Space Agency mission, will officially cease operations Monday, June 30, when the command to switch off the transmitter is uplinked to the spacecraft. Ulysses, which operated for more than 18 years, had charted the unexplored regions of space above the poles of the sun.

The Ulysses orbital path is carrying the spacecraft away from Earth. The ever-widening gap has progressively limited the amount of data transmitted. Ulysses project managers, with the concurrence of ESA and NASA, decided it was an appropriate time to end this epic scientific adventure.

Space Shuttle Discovery launched Ulysses on Oct. 6, 1990. A combination of solid fuel motors propelled Ulysses out of low-Earth orbit and toward Jupiter. Ulysses swung by Jupiter on Feb. 8, 1992. The giant planet's gravity bent the spacecraft's flight path southward and away from the ecliptic plane, putting the probe into a final orbit that would take it over the sun's south and north poles.

The European Space Agency's European Space Research and Technology Centre and European Space Operations Centre has managed the mission in coordination with NASA's Jet Propulsion Laboratory. Ulysses is tracked by NASA’s Deep Space Network. A joint ESA/NASA team at JPL has overseen spacecraft operations and data management. Teams from universities and research institutes in Europe and the U.S. provided the 10 instruments on board.

More information about the mission is available at: http://ulysses.jpl.nasa.gov

QuikScat Finds Tempests Brewing In 'Ordinary' Storms

Extratropical Cyclones near Iceland.Satellite, Now Entering Its Second Decade, Has Revolutionized Marine Weather Forecasts

"June is busting out all over," as the song says, and with it, U.S. residents along the Atlantic and Gulf coasts begin to gaze warily toward the ocean, aware that the hurricane season is revving up. In the decade since NASA's QuikScat satellite and its SeaWinds scatterometer launched in June 1999, the satellite has measured the wind speed and wind direction of these powerful storms, providing data that are increasingly used by the National Oceanic and Atmospheric Administration's (NOAA) National Hurricane Center and other world forecasting agencies. The data help scientists detect these storms, understand their wind fields, estimate their intensity and track their movement.

But tropical cyclones aren't the only storms that generate hurricane-force winds. Among others that do is a type of storm that dominates the weather in parts of the United States and other non-tropical regions every fall, winter and into spring: extratropical cyclones.

QuikScat image of a mature North Atlantic extratropical cyclone from December 1, 2004.Extratropical Cyclones: Meteorological 'Bombs'

Scientists have long known that extratropical cyclones (also known as mid-latitude or baroclinic storms) sometimes produce hurricane-force winds. But before QuikScat, hurricane-force extratropical cyclones were thought to be relatively rare. Thanks to QuikScat, we now know that such storms occur much more frequently than previously believed, and the satellite has given forecasters an effective tool for routinely and consistently detecting and forecasting them.

These storms, which occur near busy trans-oceanic shipping lanes, pose a significant threat to life and property for those on the high seas, generating high winds and waves up to 30 meters (100 feet) high. When they make landfall, in areas like Alaska, the Pacific Northwest, New England and the U.S. mid-Atlantic coast, they produce strong winds, high surf, coastal flooding, heavy rains, river flooding and even blizzard conditions.

Take the "Hanukkah Eve" extratropical cyclone of Dec. 14-15, 2006, for example. That storm viciously raked the U.S. Pacific Northwest and British Columbia with torrential rainfall and hurricane-force winds exceeding 87 knots (100 miles per hour) in spots. Dozens of people were injured and 18 people lost their lives, while thousands of trees were downed, power was knocked out for more than 1.5 million residents and structural damage topped $350 million.

NOAA defines an extratropical cyclone as "a storm system that primarily gets its energy from the horizontal temperature contrasts that exist in the atmosphere." These low pressure systems have associated cold fronts, warm fronts and occluded fronts. Tropical cyclones, in contrast, don't usually vary much in temperature at Earth's surface, and their winds are generated by the energy released as clouds and rain form in warm, moist, tropical air. While a tropical cyclone's strongest winds are near Earth's surface, the strongest winds in extratropical cyclones are about 12 kilometers (8 miles) up, in the tropopause. Tropical cyclones can become extratropical, and vice versa.

Extratropical cyclones occur in both the North Atlantic and North Pacific year-round. Those with hurricane-force winds have been observed from September through May. Their frequency typically begins to increase in October, peaks in December and January, and tapers off sharply after March. They can range from less than 100 kilometers (62 miles) in diameter to more than 4,000 kilometers (nearly 2,500 miles) across. They typically last about five days, but their hurricane-force winds are usually short-lived--just 24 hours or less. Because they can intensify rapidly, they're often referred to as meteorological "bombs." Wind speeds in extratropical cyclones can vary from just 10 or 20 knots (12 to 23 miles per hour) to hurricane-force (greater than 63 knots, or 74 miles per hour). During their development, they can trek along at more than 30 knots (35 miles per hour), but they slow down as they mature. At their seasonal peak, up to eight such storms of varying intensity have been observed at once in both the North Atlantic and North Pacific.

Early work by scientists at NASA, NOAA and other organizations demonstrated the effectiveness of using scatterometers for detecting these powerful and destructive winds. Scatterometers work by sending radar signals to the ocean surface and measuring the strength of the radar signals that bounce back. The higher the wind speed, the more the ocean surface is disturbed, and the stronger the reflection that is bounced back to the satellite.

Among those who pioneered these efforts at NASA was Senior Research Scientist Timothy Liu of NASA's Jet Propulsion Laboratory, Pasadena, Calif., who used data from the NASA Scatterometer, the predecessor to QuikScat, to study the transition of tropical cyclones into extratropical storms in 1997. In addition, Robert Atlas of NASA's Goddard Space Flight Center, Greenbelt, Md., demonstrated that scatterometer data were able to improve predictions of extratropical storm strength and location.

Raising Forecaster Awareness

Joe Sienkiewicz, chief of the Ocean Applications Branch at NOAA's Ocean Prediction Center, Camp Springs, Md., says QuikScat data have raised the awareness of forecasters to the occurrence of hurricane-force intensity conditions in extratropical cyclones and have significantly advanced their short-term wind warning and forecast processes.

"QuikScat winds have given forecasters at NOAA's Ocean Prediction Center a high level of situational awareness over the data-sparse waters of the North Atlantic and North Pacific Oceans," he said. "Ocean Prediction Center forecasters daily examine every QuikScat pass and patch of wind and frequently base wind warning and forecast decisions solely on QuikScat winds. Through confidence gained from QuikScat, the National Weather Service began issuing warnings for dangerous hurricane-force winds in extratropical cyclones in December 2000.

"From 10 years of QuikScat, we have learned that hurricane force winds in extratropical cyclones occur more frequently than thought, are most frequent in winter months, and the conditions are most often observed south of the cyclone center," he added.

Over the years, the number of storms observed with hurricane-force winds has steadily increased due to forecasters gaining confidence using the data, and improvements to the QuikScat data. From the fall of 2006 through 2008, NOAA's Ocean Prediction Center identified and issued warnings for 115 separate extratropical cyclones (64 in the Atlantic and 51 in the Pacific) that reached hurricane force.

As confirmed in a 2008 study, QuikScat substantially extends the ability of forecasters to detect hurricane-force wind events in extratropical storms. For the studied case, QuikScat was able to identify more than three-and-a-half times as many hurricane-force events as combined data from the European ASCAT sensor on the METOP-A satellite, directly-measured buoy and ship information, and model predictions.

Another study in 2002 found that incorporating QuikScat data increased the number of wind warnings the Ocean Prediction Center issued for extratropical cyclones by 30 percent in the North Atlantic and by 22 percent in the North Pacific. Between 2003 and 2006, the Ocean Prediction Center's forecasters successfully predicted hurricane-force winds two days in advance 58 percent of the time in the Atlantic and 44 percent in the Pacific. Considering that a successful forecast of hurricane-force winds requires accurate prediction of the timing and intensity of an explosive deepening cyclone, these numbers are impressive.

QuikScat data have been instrumental in the ability to forecast hurricane-force extratropical cyclones several days in advance, while they are still well out over the ocean. Forecasters can use the data to determine which numerical weather prediction models are handling a storm the best, thereby improving the accuracy of forecasts and increasing warning lead times. QuikScat data are available to forecasters within three hours of acquisition.

The availability of a consistent observing capability for extratropical cyclones from QuikScat has allowed NOAA to add a third "hurricane-force" warning category for extratropical cyclone winds, in addition to gale and storm, providing better warnings of a coming storm's severity. The U.S. Coast Guard broadcasts these warnings by radiofax, and they are posted online at: http://www.opc.ncep.noaa.gov .

A Boon to Shipping

These extratropical cyclone warnings have a great economic impact on the $200 billion global marine shipping industry. A recent study estimates improvements to warning and forecast services due to QuikScat save the container and bulk shipping industry $135 million a year by reducing their exposure to hurricane-force wind conditions in non-tropical storms over the North Pacific and North Atlantic. Without QuikScat, the severity of many extratropical cyclones would not be determined. The data are also vital to the fishing industry, offshore energy industries, search and rescue organizations, and agencies that track and manage marine hazards like oil spills.

Paul Chang, ocean winds science team lead at NOAA's National Environmental Satellite, Data and Information Service/Center for Satellite Applications and Research, Camp Springs, Md., said ocean vector wind measurements from QuikScat have become a basic part of NOAA's day-to-day forecasting and warning processes.

"The 10 years of observations from the QuikScat mission have provided critical information for the monitoring, modeling, forecasting and research of the atmosphere, oceans and climate," he said.

For more information about QuickScat, visit http://winds.jpl.nasa.gov/.

Mars Rover Yielding New Clues While Lodged in Martian Soil

Soft soil exposed when wheels of NASA's Mars Exploration Rover Spirit dug into a patch of ground.NASA's Mars rover Spirit, lodged in Martian soil that is causing traction trouble, is taking advantage of the situation by learning more about the Red Planet's environmental history.

In April, Spirit entered an area composed of three or more layers of soil with differing pastel hues hiding beneath a darker sand blanket. Scientists dubbed the site "Troy." Spirit's rotating wheels dug themselves more than hub deep at the site. The rover team has spent weeks studying Spirit's situation and preparing a simulation of this Martian driving dilemma to test escape maneuvers using an engineering test rover at NASA's Jet Propulsion Laboratory in Pasadena, Calif.

A rock seen beneath Spirit in images from the camera on the end of the rover's arm may be touching Spirit's belly. Scientists believe it appears to be a loose rock not bearing the rover's weight. While Spirit awaits extraction instructions, the rover is keeping busy examining Troy, which is next to a low plateau called Home Plate, approximately 3.2 kilometers (2 miles) southeast of where Spirit landed in January 2004.

"By serendipity, Troy is one of the most interesting places Spirit has been," said Ray Arvidson of Washington University in St. Louis. Arvidson is deputy principal investigator for the science payloads on Spirit and its twin rover, Opportunity. "We are able here to study each layer, each different color of the interesting soils exposed by the wheels."

One of the rover's wheels tore into the site, exposing colored sandy materials and a miniature cliff of cemented sands. Some disturbed material cascaded down, evidence of the looseness that will be a challenge for getting Spirit out. But at the edge of the disturbed patch, the soil is cohesive enough to hold its shape as a steep cross-section.

Spirit has been using tools on its robotic arm to examine tan, yellow, white and dark-red sandy soil at Troy. Stretched-color images from the panoramic camera show the tints best.

"The layers have basaltic sand, sulfate-rich sand and areas with the addition of silica-rich materials, possibly sorted by wind and cemented by the action of thin films of water. We're still at a stage of multiple working hypotheses," said Arvidson. "This may be evidence of much more recent processes than the formation of Home Plate...or is Home Plate being slowly stripped back by wind, and we happened to stir up a deposit from billions of years ago before the wind got to it?"

Team members from NASA's Johnson Space Center in Houston feel initial readings suggest that iron is mostly present in an oxidized form as ferric sulfate and that some of the differences in tints at Troy observed by the panoramic camera may come from differences in the hydration states of iron sulfates.

While extraction plans for the rover are developed and tested during the coming weeks, the team plans to have Spirit further analyze the soil from different depths. This research benefits from having time and power. In April and May, winds blew away most of the dust that had accumulated on Spirit's solar panels.

"The exceptional amount of power available from cleaning of Spirit's solar arrays by the wind enables full use of all of the rover's science instruments," said Richard Moddis of the Johnson team. "If your rover is going to get bogged down, it's nice to have it be at a location so scientifically interesting."

The rover team has developed a soil mix for testing purposes that has physical properties similar to those of the soil under Spirit at Troy. This soil recipe combines diatomaceous earth, powdered clay and play sand. A crew is shaping a few tons of that mix this week into contours matching Troy's. The test rover will be commanded through various combinations of maneuvers during the next few weeks to validate the safest way to proceed on Mars.

Spirit's right-front wheel has been immobile for more than three years, magnifying the challenge. While acknowledging a possibility that Spirit might not be able to leave Troy, the rover team remains optimistic. Diagnostic tests on Spirit in early June provided encouragement that the left-middle wheel remains useable despite an earlier stall.

"With the improved power situation, we have the time to explore all the possibilities to get Spirit out," said JPL's John Callas, project manager for Spirit and Opportunity. "We are optimistic. The last time Spirit spun its wheels, it was still making progress. The ground testing will help us avoid doing things that could make Spirit's situation worse."

Images and further information about Spirit and Opportunity are available at: http://marsrovers.jpl.nasa.gov and http://www.nasa.gov/rovers .

New instrument has potential to detect water deep underground on Mars

Mars Time Domain Electromagnetic SounderWith the whoosh of compressed gas and the whir of unspooling wire, a team of Boulder scientists and engineers tested a new instrument prototype that might be used to detect groundwater deep inside Mars.

The Mars Time Domain Electromagnetic Sounder (MTDEM) uses induction to generate electrical currents in the ground, whose secondary magnetic fields are in turn detected at the planetary surface. In this way, the electrical conductivity of the subsurface can be reconstructed.

"Groundwater that has been out of atmospheric circulation for eons will be very salty," says the project's principal investigator Dr. Robert Grimm, a director in the Space Science and Engineering Division at Southwest Research Institute. "It is a near-ideal exploration target for inductive systems."

The inductive principle of the MTDEM is distinct from the wavelike, surface-penetrating radars MARSIS and SHARAD presently orbiting Mars. "The radars have been very useful in imaging through ice and through very dry, low-density rock," says Grimm, "but they have not lived up to expectations to look through solid rock and find water."

The time-domain inductive method uses a large, flat-lying loop of wire on the ground to generate and receive electromagnetic signals. In order to do this robotically, the team developed a launch system that shoots two projectiles, each paying out spooled wire as they fly.

"The main challenge was getting the spooling right," says Robert Warden, a mechanical engineer at Ball Aerospace and Technologies Corp., which built the deployment system. "The spools had to be compact yet allow rapid payout of a thin wire at more than 30 meters per second (70 miles per hour)."

Data taken during the test launches allowed Warden and Grimm to scale the system for a flight mission. The MTDEM prototype deployed to a distance of more than 70 meters. For Mars, a system deploying a 200-meter loop would be less than 6 kilograms mass and could detect groundwater at depths up to 5 kilometers (3 miles). Most of the instrument's mass would be in the loop and deployment system. Barry Berdanier, the Ball electrical engineer who built the MTDEM electronics, estimates that the flight electronics would comprise just a few hundred grams.

"Electromagnetic induction methods are widely used in groundwater exploration," says James Pfieffer of Zapata Incorporated, a geophysical firm that provided field support. "We have been mapping groundwater in Hawaii for many years." The main field test of the MTDEM was on Maui, where known performance could be used to calibrate the new prototype.

Grimm adds, "Subsurface, liquid water on Mars could be a habitable zone for microbes. We know that huge volumes of discharged groundwater have shaped Mars' ancient surface. Is that water still locked inside?"

A Glowing Vision of the Early Universe

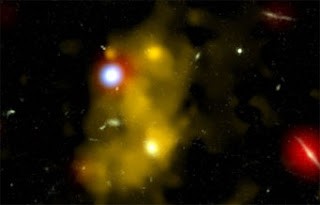
A composite image of a black hole (blue) lighting up a lyman alpha blob (yellow)Galaxy formation in the early universe just became a little less mysterious.

Cosmologists already knew the big picture. In the several hundred million years after the Big Bang, matter in the expanding universe began falling together into clumps; littler clumps within the clumps fell in on themselves to form the first stars; and many of the original clumps eventually coalesced into bigger pools to make modern-sized galaxies.

But why did galaxies come out the size they did, rather than staying small or growing indefinitely huge? Astronomers have new insight on this question thanks to images obtained in 2007 by NASA's Chandra X-ray Observatory and released to the public today.

Scientists have known for nearly 10 years about gassy objects in the early universe called “Lyman-alpha blobs.” They’re named for their emission of ultraviolet light at the Lyman-alpha wavelength given off by hot hydrogen atoms. The energy to make the blobs light up must come from somewhere. In a paper to be published in the July 10th Astrophysical Journal, a team describes observing a region of Lyman-alpha blobs called SSA22 about a half million light-years in diameter. They say they have found why the blobs shine and have also turned up a correlation between the blobs and active black holes at the center of galaxies within them.

Massive black holes exist in most galaxies, but only some of the holes are consuming matter fast enough to light up brightly. Co-author Jim Geach (Durham University, UK) says 1% to 10% of galaxies in general have an active-black-hole nucleus, but the percentage is five times higher among the early galaxies with Lyman-alpha blobs surrounding them. These are large galaxies in the late stages of formation, seen when the universe was only about 15% of its present age. By then the holes in question had grown very massive, to roughly a billion solar masses.

Apparently, when we see a Lyman-alpha blob we are seeing the blaze from these black holes (and perhaps from nascent stars) heating a galaxy’s remaining gas and driving it off into intergalactic space, thereby preventing it from coalescing into new stars. In other words, we’re seeing galaxies at the point when they shut off their own growth.

Theorists modeling the early universe have been eager to observe this crucial “feedback” stage in galaxy evolution. The feedback mechanism explains the strong correlation between the mass of a galaxy’s central bulge of old stars and the mass of its central black hole (the ratio is always about 700 to 1). The growing flood of radiation from the growing black hole blows remaining gas out of the galaxy — both preventing the galaxy from forming new stars and preventing the hole’s further growth. (The gassy disk of a spiral galaxy, full of younger stars, would be the result of new material falling in later.)

This transition stage should be brief in cosmic terms, which is why it has been hard to catch in progress. But the research team suspects that nearly all galaxies should go through it.

New JPL Building Goes Green for the Gold

A rooftop, drought-resistant garden is among the When residents of the top floors of JPL's new Flight Projects Center look out their windows down to the roof of the building's auditorium, they won't see black tar. Instead, they'll witness what looks more like Joshua Tree, Calif. -- desert, drought-resistant plants dotting sandy ground.

The plants do more than enhance the view; they are part of the building's many "green" features. In fact, the building is so green that JPL is going for the gold -- a gold certification, that is, under the Leadership in Energy and Environmental Design rating system, set up by the non-profit U.S. Green Building Council.

The six-story Flight Projects Center will house missions in the busy design and development phases, when engineers and scientists from all around the world must work together closely. The first tenants are expected to move in this September.

To achieve a gold-level certification, the building must meet certain criteria. In general, it must consume water, energy and resources efficiently; treat the environment in friendly ways; and create a healthy and comfortable indoor workspace. Some of the building's green assets are listed here:

• A green, living roof will keep the building cool in the summer and warm in the winter. The green roof will also help minimize storm water runoff into the Arroyo Seco, a dry riverbed near JPL.

• Outdoor lights will be used solely for safety purposes. The lights are directed toward the ground, reducing the amount of light pollution that escapes to the night sky.

• Desert plants on the roof and the rest of the landscape will require 72 percent less water than a typical landscape design in Southern California.

• Low-flow faucets and toilets will reduce water use by 40 percent compared with typical fixtures. The building will save an estimated 500,000 gallons of water every year.

• Improved wall insulation, efficient chillers and boilers, window shading devices and the green roof will greatly reduce energy needs.

• More than 75 percent of the waste generated during construction was diverted from a landfill to a local recycling facility. Wood was acquired from Forest Stewardship Council certified suppliers, ensuring sustainable harvesting of trees.

• The paints and other surface materials have low levels of undesirable, toxic fumes.

• The heating and cooling system is "smart" -- it knows whether people are in a room and adjusts the temperature and ventilation accordingly.

• The janitorial staff will use green cleaning products and practices.

• Showers and bike racks will encourage people to leave their cars at home, and bike or walk to work.

More information about the Leadership in Energy and Environmental Design rating system and the U.S. Green Building Council is online at http://www.usgbc.org .

Galaxies Coming of Age in Cosmic Blobs

Galaxy inside of a glowing hydrogen The "coming of age" of galaxies and black holes has been pinpointed, thanks to new data from NASA's Chandra X-ray Observatory and other telescopes. This discovery helps resolve the true nature of gigantic blobs of gas observed around very young galaxies.

About a decade ago, astronomers discovered immense reservoirs of hydrogen gas -- which they named "blobs" – while conducting surveys of young distant galaxies. The blobs are glowing brightly in optical light, but the source of immense energy required to power this glow and the nature of these objects were unclear.

A long observation from Chandra has identified the source of this energy for the first time. The X-ray data show that a significant source of power within these colossal structures is from growing supermassive black holes partially obscured by dense layers of dust and gas. The fireworks of star formation in galaxies are also seen to play an important role, thanks to Spitzer Space Telescope and ground- based observations.

"For ten years the secrets of the blobs had been buried from view, but now we've uncovered their power source," said James Geach of Durham University in the United Kingdom, who led the study. "Now we can settle some important arguments about what role they played in the original construction of galaxies and black holes." Galaxies are believed to form when gas flows inwards under the pull of gravity and cools by emitting radiation. This process should stop when the gas is heated by radiation and outflows from galaxies and their black holes. Blobs could be a sign of this first stage, or of the second.

Based on the new data and theoretical arguments, Geach and his colleagues show that heating of gas by growing supermassive black holes and bursts of star formation, rather than cooling of gas, most likely powers the blobs. The implication is that blobs represent a stage when the galaxies and black holes are just starting to switch off their rapid growth because of these heating processes. This is a crucial stage of the evolution of galaxies and black holes - known as "feedback" - and one that astronomers have long been trying to understand.

"We're seeing signs that the galaxies and black holes inside these blobs are coming of age and are now pushing back on the infalling gas to prevent further growth," said coauthor Bret Lehmer, also of Durham. "Massive galaxies must go through a stage like this or they would form too many stars and so end up ridiculously large by the present day."

Chandra and a collection of other telescopes including Spitzer have observed 29 blobs in one large field in the sky dubbed "SSA22." These blobs, which are several hundred thousand light years across, are seen when the Universe is only about two billion years old, or roughly 15% of its current age.

In five of these blobs, the Chandra data revealed the telltale signature of growing supermassive black holes - a point-like source with luminous X-ray emission. These giant black holes are thought to reside at the centers of most galaxies today, including our own. Another three of the blobs in this field show possible evidence for such black holes. Based on further observations, including Spitzer data, the research team was able to determine that several of these galaxies are also dominated by remarkable levels of star formation.

The radiation and powerful outflows from these black holes and bursts of star formation are, according to calculations, powerful enough to light up the hydrogen gas in the blobs they inhabit. In the cases where the signatures of these black holes were not detected, the blobs are generally fainter. The authors show that black holes bright enough to power these blobs would be too dim to be detected given the length of the Chandra observations.

Besides explaining the power source of the blobs, these results help explain their future. Under the heating scenario, the gas in the blobs will not cool down to form stars but will add to the hot gas found between galaxies. SSA22 itself could evolve into a massive galaxy cluster.

"In the beginning the blobs would have fed their galaxies, but what we see now are more like leftovers," said Geach. "This means we'll have to look even further back in time to catch galaxies and black holes in the act of forming from blobs."

These results will appear in the July 10 issue of The Astrophysical Journal. NASA's Marshall Space Flight Center in Huntsville, Ala., manages the Chandra program for NASA's Science Mission Directorate in Washington. The Smithsonian Astrophysical Observatory controls Chandra's science and flight operations from Cambridge, Mass.

More information, including images and other multimedia, can be found at: