Lighting Up the Night

Lighting Up the Night Sky

Symphony in Blue

Warped Debris Disks Around Stars Are Blowin’ in the Wind

The inner, yellow portion of HD 61005's disk spans 5.4 billion miles, or about the width of Neptune's orbit in our own solar systemThe dust-filled disks where new planets may be forming around other stars occasionally take on some difficult-to-understand shapes. Now, a team led by John Debes at NASA's Goddard Space Flight Center in Greenbelt, Md., finds that a star's motion through interstellar gas can account for many of them.

"The disks contain small comet- or asteroid-like bodies that may grow to form planets," Debes said. "These small bodies often collide, which produces a lot of fine dust." As the star moves through the galaxy, it encounters thin gas clouds that create a kind of interstellar wind. "The small particles slam into the flow, slow down, and gradually bend from their original trajectories to follow it."

Far from being empty, the space between stars is filled with patchy clouds of low-density gas. When a star encounters a relatively dense clump of this gas, the resulting flow produces a drag force on any orbiting dust particles. The force only affects the smallest particles -- those about one micrometer across, or about the size of particles in smoke.

"This fine dust is usually removed through collisions among the particles, radiation pressure from the star's light and other forces," explained Debes. "The drag from interstellar gas just takes them on a different journey than they otherwise would have had."

Working with Alycia Weinberger at the Carnegie Institution of Washington and Goddard astrophysicist Marc Kuchner, Debes was using the Hubble Space Telescope to investigate the composition of dust around the star HD 32297, which lies 340 light-years away in the constellation Orion. He noticed that the interior of the dusty disk -- a region comparable in size to our own solar system -- was warped in a way that matched a previously known warp at larger distances.

"Other research indicated there were interstellar gas clouds in the vicinity," Debes said. "The pieces came together to make me think that gas drag was a good explanation for what was going on."

"It looks like interstellar gas helps young planetary systems shed dust much as a summer breeze helps dandelions scatter seeds," Kuchner said.

As dust particles respond to the interstellar wind, a debris disk can morph into peculiar shapes determined by the details of its collision with the gas cloud. In a face-on encounter, such as that of the star HD 61005 in the constellation Puppis, the disk's edge bends gently away from the direction of motion. Fine dust trails behind, forming a cylindrical wake. If the disk instead slices edgewise through interstellar gas, the resulting headwind blows away fine dust from the portion inside the cloud, resulting in a lop-sided disk.

"The drag from interstellar gas only affects the outskirts of the disk, where the star's gravity can't really hold onto the material," Weinberger said.

The systems studied are about 100 million years old and resemble our own solar system shortly after the major planets formed. Although astronomers don't know whether planets lurk within the disks of these systems, a better understanding of processes affecting a disk's outer regions will shed light on how "ice giant" planets like Uranus and Neptune -- and the more distant swarm of small, icy bodies known as the Kuiper Belt -- formed within the solar system.

Astronomers have sometimes attributed warps and bends in debris disks to the presence of undiscovered planets or to past encounters with another star. "But we expect interstellar gas to be around -- it's everywhere," Debes said. "It's important to consider the ecology of these debris disks before running to such conclusions, and this model explains a lot of the weirdly shaped disks we see."

A paper describing the model appears in the September 1 issue of The Astrophysical Journal.

Related link:

NASA Supercomputer Shows How Dust Rings Point to Exo-Earths
http://www.nasa.gov/centers/goddard/news/topstory/2008/dust_rings.html

Science Instruments Ready for SOFIA Airborne Telescope

The SOFIA airborne observatory's 2.5-meter infrared telescope peers out from the SOFIA 747SP's rear fuselage during nighttime line operations testingScientists are busy preparing for the "First Light" flight of NASA's Stratospheric Observatory for Infrared Astronomy, or SOFIA, a highly modified Boeing 747SP with a 2.5-meter (8.2-foot) diameter infrared telescope installed in its rear fuselage. The first-light astronomical observation flights are now tentatively scheduled for Spring 2010 from NASA's Dryden Aircraft Operations Facility in Palmdale, Calif.

A team of international partners is developing eight instruments that will enable SOFIA to study the universe primarily in the infrared spectral band, but with capabilities extending from wavelengths of 0.3 to 1600 microns, across ultraviolet, visible, infrared, and sub-millimeter ranges.

"Working with our German colleagues, we are eagerly anticipating SOFIA's First Light flight," said Erick Young, SOFIA's recently appointed director of Science and Mission Operations. "SOFIA will be a discovery engine for the next 20 years, and our collaborator teams have spent a number of years perfecting these powerful scientific instruments."

The German-built 2.5-meter infrared telescope is nestled in its cavity in the SOFIA airborne observatoryFour of the new instruments are now ready for use on the airborne observatory. They include:
  • The Faint Object infraRed Camera for the SOFIA Telescope, or FORCAST, a mid-infrared camera developed at New York's Cornell University that operates at wavelengths of 5-40 microns;
  • A heterodyne spectrometer called the German Receiver for Astronomy at Terahertz Frequencies or GREAT, which operates at 60-200 microns. GREAT was developed at the Max Planck Institute for Radioastronomy, Bonn, Germany;
  • The Lowell Observatory's High-Speed Imaging Photometer for Occultations, or HIPO, which operates in the 0.3 to 1.1 micron range;
  • The Far-Infrared Field-Imaging Line Spectrometer, or FIFI-LS, that operates from 42 to 210 microns, FIFI-LS was developed at the Max Planck Institute for Extraterrestrial Physics, in Garching, Germany.
Several other instruments will be installed later. They include:
  • The CAltech Submillimeter Interstellar Medium Investigations Receiver, or CASIMIR, another heterodyne spectrometer. CASIMIR operates in the 250-600 micron range, and The Lowell Observatory's High-speed Imaging Photometer for Occultation rests on its dolly in the lab prior to installation on the SOFIA airborne observatoryis being built at the California Institute of Technology in Pasadena;
  • The High-resolution Airborne Wideband Camera or HAWC, a far-infrared bolometer camera that functions in the 50-240 micron range, developed by the University of Chicago;
  • Echelon-Cross-Echelle Spectrograph, or EXES, an echelon spectrometer under construction at the University of California in Davis that operates between five and 28 microns; and
  • The First Light Infrared Test Experiment CAMera, or FLITECAM, a near-infrared camera in the one-to-five micron range being developed at the University of California in Los Angeles.
Three of the first nine instruments have been thoroughly tested on ground-based telescopes – HIPO at the Lowell Observatory in Flagstaff, Ariz., FLITECAM at the University of California's Lick Observatory, and FORCAST on Caltech's Mt. Palomar five-meter telescope. HIPO has also been mounted on SOFIA's telescope and used to observe celestial objects from the ground to test the observatory's systems during line operations in Palmdale in late 2008. FORCAST is slated for installation for SOFIA's First Light flight, when photons from a celestial object come down the telescope tube for the first time while the aircraft is airborne.

GREAT, which has been tested in a lab environment, awaits its flight opportunity where it will be able to demonstrate its capabilities. This spectrometer has not yet been tested onboard SOFIA because it analyzes infrared wavelengths that are entirely inaccessible from the ground.

SOFIA will fly with one instrument fitted to the telescope for each airborne observation period.

When flying science missions, SOFIA cruises between 39,000 and 45,000 feet at a speed of Mach 0.8 – about 520 mph – on seven- to nine-hour observing flights. When in full operation, the observatory will typically fly three nights per week for approximately 1,000 hours of observing time each year.

SOFIA's telescope weighs 34,000 pounds and was built in Germany by MAN Technologie AG and Kayser-Threde GmbH. It has an elevation range of 20 to 60 degrees above the horizon, and a clear, undistorted field-of-view diameter of 8 arc minutes – about a quarter the diameter of the full moon.

SOFIA is the successor to NASA's extremely successful Kuiper Airborne Observatory, a modified Lockheed C-141 fitted with a one-meter infrared telescope that operated from NASA's Ames Research Center in Mountain View, Calif., from 1974 to 1995.The Kuiper observatory discovered the rings around the planet Uranus, the atmosphere surrounding the planet Pluto, and the presence of water vapor in the interstellar medium.

The new SOFIA observatory is a joint NASA and German Space Agency (Deutsches Zentrum fur Luft- und Raumfahrt, or DLR) program. The development program is currently managed at NASA's Dryden Flight Research Center, Edwards, Calif. with the aircraft based at the Dryden Aircraft Operations Facility in Palmdale. NASA's Ames Research Center manages SOFIA science and mission operations in cooperation with the Universities Space Research Association and the Deutsches SOFIA Institute in Stuttgart, Germany.

To learn more about SOFIA, visit these Web sites:
http://www.nasa.gov/mission_pages/SOFIA/index.html
www.sofia.usra.edu

Discovery Docked at Station

STS-128 mission

At 11:49 p.m. EDT, Nicole Stott exchanged Soyuz seat liners with space station Flight Engineer Tim Kopra. Stott now is a member of the space station Expedition 20 crew, and Kopra is a member of Discovery’s crew. Kopra spent 44 days as a member of Expedition 20.

Space Shuttle Mission: STS-128

The Expedition 20 crew welcomes the STS-128 crew aboard the station
Image above: The Expedition 20 crew welcomes the STS-128 crew aboard the station shortly after hatch opening.

Discovery Docks, Joint Operations Begin

Space shuttle Discovery docked with the International Space Station at 8:54 p.m. EDT Saturday delivering more than seven tons of cargo and a new crew member to the International Space Station and its Expedition 20 crew.

The shuttle and station crews opened hatches at 9:33 p.m. and greeted one another beginning a week’s worth of joint operations that includes three spacewalks and transfer of 15,000 pounds of supplies and logistics to sustain the six-person crew on the station.

Astronauts Nicole Stott and Tom Kopra swapped Soyuz seat liners after hatch opening. Stott will handle flight engineer duties aboard the station until her return home aboard Atlantis following the STS-129 mission in November. Kopra is scheduled to return aboard Discovery Sept. 10 after 57 days in space.

Before docking to the station, Commander Rick Sturckow and Pilot Kevin Ford performed a few final corrective jet firings to refine the orbiter’s path for a rendezvous pitch maneuver (RPM). While Sturckow performed the RPM, Expedition 20 Commander Gennady Padalka and Flight Engineer Mike Barratt took photos from the station. Their photos will be reviewed by experts on the ground for evidence of damage to the shuttle tiles.

STS-128 Additional Resources
› Mission Summary (593 Kb PDF)
› Press Kit (3.7 Mb PDF)
› More about STS-128 Crew

Orbiter Status
› About the Orbiters

NASA Awards Construction Services Contracts

NASA's Glenn Research Center has selected four Ohio companies to provide electrical, mechanical and structural construction-related activities. The work will support both institutional and research construction needs at Glenn's Lewis Field and the Plum Brook Station in Sandusky, Ohio.

The selected companies are EdArch-Erie J.V. of Shaker Heights; R.J. Runge of Port Clinton; KBJ Inc. of Oakwood Village; and Pinnacle Construction and Development Group Inc. of Willoughby.

The contracts begin in early October with a one-year base period followed by four one-year options. Each contract has an indefinite delivery, indefinite quantity provision with work performed through fixed price task orders. The selected companies will compete for the tasks. Each contract will have a minimum value of $500,000 and a maximum value of $20 million.

For more information about Glenn, visit:

http://www.nasa.gov/glenn

NASA Awards Contract for Pressure Systems Certification

NASA's Glenn Research Center has awarded a cost-plus-fixed-fee contract valued at $30 million to Mainthia Technologies, Inc. (MTI) of Cleveland.

MTI will provide on-site services for the certification of pressure vessels and systems, and the operation, maintenance and engineering of cryogenic systems. MTI also will provide recertification, repairs and periodic in-service inspections and maintain the accuracy of the certification activities database.

The systems and equipment to be certified and maintained under this contract are housed in various buildings and locations throughout Glenn and the Plum Brook Station in Sandusky, Ohio.

The contract begins on Oct. 1, 2009, with a two-year base period followed by three one-year options.

For more information about NASA and agency programs, visit

http://www.nasa.gov

NASA Extends Space Station Cargo Integration Contract

NASA has awarded Lockheed Martin Integrated Systems Inc. in Houston a one-year contract extension valued at $33 million to provide integration services for cargo delivery to and from the International Space Station.

Lockheed Martin has held the station's cargo mission contract since January 2004. The one-year extension will bring the total value of the contract to $381 million.

The contract provides cargo packing for delivery to and from the space station, consisting of pressurized and unpressurized science and logistics carriers, assembly hardware and crew support. Other contract services include determining the most efficient way to pack cargo, verifying the adequacy of the integrated carriers, packing the pressurized cargo into sub-carriers and returning the cargo to providers once it returns to Earth. The contract also provides sustaining engineering for NASA carriers.

The extension begins Oct. 1, 2009. It is the second of two such options provided for in the original contract.

Major subcontractors include Astrium GmbH in Bremen, Germany; Bastion Technologies Inc. in Houston; BAE Systems in Fayetteville, Ga.; Futron Corporation in Bethesda, Md.; LZ Technology Inc. in Alvin, Texas; MEI Technologies, Inc. in Houston; Oceaneering Space Systems in Houston, Rothe Enterprises, Inc. in San Antonio; SPACEHAB Inc. in Houston; System Studies and Simulation, Inc. in Huntsville, Ala.; Teledyne Brown Engineering, Inc. in Huntsville, Ala.; and United Space Alliance, LLC in Houston. The work will be performed at NASA's Johnson Space Center in Houston and Kennedy Space Center in Florida.

For more information about the space station, visit:

http://www.nasa.gov/station

Honey Bees Turned Data Collectors Help Scientists Understand Climate Change

Estimates are that there are somewhere between six and ten million species of insects on the planet, yet few are as charismatic as the honey bee.

Composite image of honeybees on honeycomb and beekeeper opening hivePart of an order of winged insects called Hymenoptera, honey bees are best known for being prodigious producers of honey, the sweet amber substance they produce by partially digesting and repeatedly regurgitating the sugar-rich nectar found within the petals of flowering plants. They're also the workhorses of the modern industrial agricultural system, relied upon to pollinate crops ranging from almonds to watermelons to peaches. And they're even noted dancers capable of performing an array of complex "waggle" dances to communicate.

And now -- thanks to an innovative project conceived by Wayne Esaias, a veteran oceanographer at NASA's Goddard Space Flight Center in Greenbelt, Md. -- bees have yet another role: that of climate data collectors.

Wayne Esaias, a NASA scientist, records the weight data of one of his beehivesWhen honey bees search for honey, colony scouts tend to scour far and wide and sample the area around a hive remarkably evenly, regardless of the size of the hive. And that, Esaias explained, means they excel in keeping tabs on the dynamics of flowering ecosystems in ways that even a small army of graduate students can not.

The key piece of data bees collect relates to the nectar flow, which in the mid-Atlantic region tends to come in a burst in the spring. Major nectar flows, typically caused by blooms of tulip-poplar and black locust trees, leave an unmistakable fingerprint on beehives -- a rapid increase in hive weight sometimes exceeding 20 pounds per day. When a nectar flow finishes, the opposite is true: hives start to lose weight, sometimes by as much as a pound a day.

By creating a burgeoning network of citizen scientists who use industrial-sized scales to weigh their hives each day -- HoneyBeeNet -- Esaias aims to quantify the dynamics of nectar flow over time. Participating beekeepers send their data to Esaias who analyzes it, and posts nectar flow trend graphs and other environmental data for each collection site on HoneyBeeNet's webpage.

Beehive in Friendship, MDThe size of HoneyBeeNet, which relies almost entirely on small-scale backyard beekeepers, has doubled over the last year and now includes more than 87 data collection sites. While the majority of sites are in Maryland, HoneyBeeNet now has sites in more than 20 states.

Data from the network, when combined with additional data that reach back to the 1920’s, indicate that the timing of spring nectar flows have undergone extraordinary changes. "Each year, the nectar flow comes about a half-day earlier on average," said Esaias. "In total, since the 1970s, it has moved forward by about month in Maryland."

Esaias and Goddard colleague Robert Wolfe recently compared nectar flow data from HoneyBeeNet to satellite data that measures the annual "green up" of vegetation in the spring, one of the first times that scientists have attempted such a comparison. They corresponded nearly perfectly, confirming the usefulness of the citizen-science derived data from HoneyBeeNet to address changes in nectar flows.

What's to blame for the remarkable warming trend in Maryland? Washington's growth has certainly played a role. Urban areas, explained Esaias, produce a "heat island" effect that causes temperatures in surrounding areas to creep upward. But, in addition to that, Esaias suspects that climate change is also contributing.

And that has him nervous. "A month is a long time. If this keeps up, and the nectar flows continue to come earlier and earlier, there's a risk that pollinators could end up out of sync with the plant species that they've pollinated historically," Esaias said.

Map of Maryland beekeepersHe's not the only researcher who's looking at this issue. The National Academies of Science published a landmark report in 2007 that highlighted the precarious status of pollinators in North America.

Many pollinators -- ranging from honey bees, to bumble bees, to lesser known species seem to be in the midst of protracted population declines. Managed honey bee colonies, for example, have seen their numbers fall from about 5.9 million in 1947 to just 2.4 million in 2005.

In most cases, it isn't clear what's causing the population declines or whether climate change is exacerbating the problem, though many researchers suspect that new types of viruses, mites and other parasites and pesticides are important factors.

"But it's not just the honey bees that we need to be looking at," said May Berenbaum, an ecologist at the University of Illinois at Urbana-Champaign and the lead author on the National Academies report. "For honey bees, at least we can truck them around or feed them when there's a problem. It's the wild species of pollinators that are the greatest cause for concern."

Bumblebees, wasps, butterflies, and countless other insects -- as well as some bats and birds -- are the glue that keeps many wild ecosystems intact through pollination. And scientists are only beginning to comprehend the potential consequences that could unfold if the pollinators and the plants that rely on them get so far out of sync that extinctions begin to occur.

"To borrow an old analogy that Paul Ehrlich often used, with the wild pollinators, losing a species is a bit like losing screws in a plane" said Berenbaum. "If you lose a few here or there, it's not the end of the world, and your plane can still fly. But if you lose too many, at some point, the whole plane can suddenly come apart in mid-flight."

Indeed, entomologists have hardly begun the task of identifying wild pollinators, not to mention determining definitely which species are threatened or how they might respond as the climate shifts. Esais' research offers hints about how bees might respond to climate change. Still, scientists estimate that there are more than 30,000 different bee species alone, and only about half of them have been formally described.

Though just a proverbial drop in the honey bucket, HoneyBeeNet is one way that citizens can help scientists better understand how climate change is affecting one species of pollinator. Alice Parks, a backyard beekeeper from West Friendship, Md., has participated for two years. She bought a used scale for just $26 at an auction, and weighs her hive every night.

“Weighing can be a chore sometimes,” she said. “But it’s such an incredibly rewarding project that it’s worth it. I’m learning so much about my bees that's making me a better beekeeper, but I’m also contributing to a larger project that’s helping scientists address environmental problems on a global scale.”

Related Links:

> HoneyBeeNet
> Buzzing about Climate Change
> Wayne Esaias Tracks Honey Bees in a Changing Climate

Launch Team Targets Aug. 28 Launch

NASA is targeting space shuttle Discovery for a launch attempt Friday morning at 12:22 a.m., mission management team Chairman Mike Moses said. Engineers will evaluate a liquid hydrogen valve that developed problems during tanking operations Tuesday evening. Detailed test data about the valve will be examined before Discovery’s fuel tank is loaded with propellant ahead of Friday morning’s launch attempt.

International Space Shuttle Mission: STS-128

Space shuttle Discovery
Space shuttle Discovery stands on Launch Pad 39A on Tuesday evening after the second launch attempt was called off because of a problem with a fill-and-drain valve.

Discovery Readies for Station Resupply Flight

Space shuttle Discovery will carry the Leonardo supply module to the International Space Station during STS-128, along with a new crew member for the station, Nicole Stott.

Commanded by veteran astronaut Rick "C.J." Sturckow, the STS-128 mission crew will deliver refrigerator-sized racks full of equipment, including the COLBERT treadmill, an exercise device named after comedian Stephen Colbert.

Stott will take the place of Tim Kopra, who moved into the station during STS-127. Pilot Kevin Ford and Mission Specialists Patrick Forrester, Jose Hernandez, John "Danny" Olivas and Sweden's Christer Fuglesang round out the crew.

STS-128 Additional Resources
› Mission Summary (593 Kb PDF)
› Press Kit (3.7 Mb PDF)
› More about STS-128 Crew

Orbiter Status
› About the Orbiters

Map Characterizes Active Lakes Below Antarctic Ice

Dots represent the locations where scientists have identified 124 active lakes below the ice sheet in AntarcticaLakes in Antarctica, concealed under miles of ice, require scientists to come up with creative ways to identify and analyze these hidden features. Now, researchers using space-based lasers on a NASA satellite have created the most comprehensive inventory of lakes that actively drain or fill under Antarctica's ice. They have revealed a continental plumbing system that is more dynamic than scientists thought.

"Even though Antarctica's ice sheet looks static, the more we watch it, the more we see there is activity going on there all the time," said Benjamin Smith of the University of Washington in Seattle, who led the study.

Unlike most lakes, Antarctic lakes are under pressure from the ice above. That pressure can push melt water from place to place like water in a squeezed balloon. The water moves under the ice in a broad, thin layer, but also through a linked cavity system. This flow can resupply other lakes near and far.

Understanding this plumbing is important, as it can lubricate glacier flow and send the ice speeding toward the ocean, where it can melt and contribute to sea level change. But figuring out what's happening beneath miles of ice is a challenge.

Researchers led by Smith analyzed 4.5 years of ice elevation data from NASA's Ice, Cloud and land Elevation satellite (ICESat) to create the most complete inventory to date of changes in the Antarctic plumbing system. The team has mapped the location of 124 active lakes, estimated how fast they drain or fill, and described the implications for lake and ice-sheet dynamics in the Journal of Glaciology.

What Lies Beneath

For decades, researchers flew ice-penetrating radar on airplanes to "see" below the ice and infer the presence of lakes. In the 1990s, researchers began to combine airborne- and satellite-based data to observe lake locations on a continent-wide scale.

Scientists have since established the existence of about 280 "subglacial" lakes, most located below the East Antarctic ice sheet. But those measurements were a snapshot in time, and the question remained as to whether lakes are static or dynamic features. Were they simply sitting there collecting water?

In 2006 Helen Fricker, a geophysicist at the Scripps Institution of Oceanography, La Jolla, Calif., used satellite data to first observe subglacial lakes on the move. Working on a project to map the outline of Antarctica's land mass, Fricker needed to differentiate floating ice from grounded ice. This time it was laser technology that was up to the task. Fricker used ICESat's Geoscience Laser Altimeter System and measured how long it took a pulse of laser light to bounce of the ice and return to the satellite, from which she could infer ice elevation. Repeating the measurement over a course of time revealed elevation changes.

Fricker noticed, however, a sudden dramatic elevation change -- over land. It turned out this elevation change was caused by the filling and draining of some of Antarctica's biggest lakes.

"Sub-ice-sheet hydrology is a whole new field that opened up through the discovery of lakes filling and draining on relatively short timescales and involving large volumes of water," said Robert Bindschadler, a glaciologist at NASA's Goddard Space Flight Center in Greenbelt, Md., who has used ICESat data in other studies of Antarctica. "ICESat gets the credit for enabling that discovery."

Networking in the Antarctic

But were active lakes under the ice a common occurrence or a fluke?

To find out, Ben Smith, Fricker and colleagues extended their elevation analysis to cover most of the Antarctic continent and 4.5 years of data from ICESat's Geoscience Laser Altimeter System (GLAS). By observing how ice sheet elevation changed between the two or three times the satellite flew over a section every year, researchers could determine which lakes were active. They also used the elevation changes and the properties of water and ice to estimate the volume change.

Only a few of the more than 200 previously identified lakes were confirmed active, implying that lakes in East Antarctica's high-density "Lakes District" are mostly inactive and do not contribute much to ice sheet changes.

Most of the 124 newly observed active lakes turned up in coastal areas, at the head of large drainage systems, which have the largest potential to contribute to sea level change.

"The survey identified quite a few more subglacial lakes, but the locations are the intriguing part," Bindschadler said. "The survey shows that most active subglacial lakes are located where the ice is moving fast, which implies a relationship."

Connections between lakes are apparent when one lake drains and another simultaneously fills. Some lakes were found to be connected to nearby lakes, likely through a network of subglacial tunnels. Others appeared to be linked to lakes hundreds of miles away.

The team found that the rate at which lake water drains and fills varies widely. Some lakes drained or filled for periods of three to four years in steady, rather than episodic, changes. But water flow rates beneath the ice sheet can also be as fast as small rivers and can rapidly supply a lubricating film beneath fast-flowing glaciers.

"Most places we looked show something happening on short timescales," Smith said. "It turns out that those are fairly typical examples of things that go on under the ice sheet and are happening all the time all over Antarctica."

Related Links

› An inventory of active subglacial lakes in Antarctica detected by ICESat, 2003-2008 (pdf)
› Something Under the Ice is Moving
› Newly Discovered Antarctic Lakes, Feb. 4, 2006
› Lakes Drain under Antarctic Ice Sheet, April 24, 2007
› Subglacial Lakes, Antarctica, April 27, 2007
› Antarctica's Land and Ice Elevation

NASA And Google Launch Virtual Exploration of The Moon

Forty years ago on July 20, 1969, the world watched as the crew of Apollo 11 took the first steps on the surface of the moon.

To celebrate this historic occasion, NASA and Google announced the launch of the Moon in Google Earth, an interactive, 3D atlas of the moon, viewable with Google Earth 5.0.

The announcement was made during a press conference at the Newseum in Washington, featuring remarks by Apollo 11 astronaut Buzz Aldrin; Alan Eustace, a Google senior vice president; Andrew Chaikin, author and space historian; and Anousheh Ansari, the first female space tourist.

With the Moon in Google Earth, users can explore a virtual moonscape, follow guided tours from astronauts Buzz Aldrin and Jack Schmidt, view high-resolution "street view" style panoramic images and see previously unreleased footage captured from the lunar surface.

Whether rediscovering iconic moments from the history of lunar exploration, or learning about them for the first time, the Moon in Google Earth enables users to better understand the moon and mankind's relationship to it using an immersive, 3D experience.

The result of a close collaboration with NASA, the Moon in Google Earth showcases current and historic content about the moon. All NASA data sets used in the Moon in Google Earth are included on a non-exclusive basis.

"Today's announcement builds on the ongoing relationship with Google that Ames Research Center initiated in November 2006, when we signed a Space Act Agreement to foster collaboration with our Silicon Valley neighbor," said S. Pete Worden, director of NASA's Ames Research Center at Moffett Field, Calif. "We're excited to be a part of this latest chapter in Google's efforts to bring virtual exploration of the moon to anyone with a computer."

In addition to satellite imagery and topographical data, the following layers can be explored:

• Featured Satellite Imagery – Explore overlaid satellite imagery and detailed descriptions of selected areas on the moon from Arizona State University's "Lunar Image of the Week."
• Spacecraft Imagery - View selected imagery captured by the Apollo Metric Camera, and the Clementine and the Lunar Orbiter spacecraft
• Apollo Missions – Travel back to the Apollo era and discover the landing sites of Apollo missions 11-17. Explore "street view" style panoramic images, watch previously unreleased footage from spacecraft films and read about the places astronauts saw on their trips to the moon.
• Guided Tours – Take a narrated tour of the moon with Apollo astronauts Buzz Aldrin (Apollo 11) and Jack Schmitt (Apollo 17)
• Historic Maps – Explore Apollo-era geologic and topographic maps of the moon.
• Human Artifacts – Learn about the various types of exploratory equipment that humans have left on the moon and where those objects can be found today.

To view the Moon in Google Earth, open Google Earth 5.0 and switch modes from "Earth" to "Moon" on the top toolbar. To learn more about Moon in Google Earth, visit: earth.google.com/moon.

The Moon in Google Earth was jointly developed by Google, the NASA Ames Intelligent Robotics Group, and the SETI Institute as part of NASA's Planetary Content project.

Data sets for the Moon in Google Earth were developed with the assistance of the United States Geologic Survey (USGS), Arizona State University and the Lunar and Planetary Institute. The Japan Aerospace Exploration Agency provided terrain data from the Kaguya orbiter. The initial release does not contain any imagery from the Lunar Reconnaissance Orbiter.

The NASA Lunar Mapping and Modeling Project provided a high-resolution base map and 3D terrain model covering a portion of the nearside lunar equatorial region, which was developed using new digital scans of the Apollo 15 Metric Camera (orbit 33) images made by Arizona State University and NASA's Johnson Space Center in Houston. he NASA Exploration Systems Mission Directorate Analogs Program provided content for the Apollo 17 tour.

For more information about NASA's plans to return to the moon and explore beyond visit exploration.nasa.gov.

New Vision for 'Eyes on the Earth' 3D

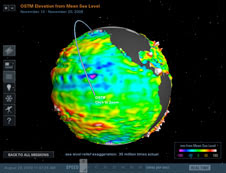
Enhanced capabilities of NASA's Eyes on the Earth visualization tool include displays of the recent data maps of ozone, sea level or carbon dioxide and a video tourNASA’s “Eyes on the Earth 3D” is back and better than ever before. This online experience now offers new features that allow users to view the latest data beamed back from NASA space satellites – in some cases, less than a few hours old. Developed using a state-of-the-art, browser-based visualization technology, "Eyes on the Earth 3D" displays the location of all of NASA's 15 currently operating Earth-observing missions in real time. These missions constantly monitor our planet's vital signs, such as sea level height, concentration of carbon dioxide in our atmosphere, global temperatures and extent of sea ice in the Arctic, to name but a few. By using the new toolbar on the left of the screen, users can display the latest data maps of ozone, sea level or carbon dioxide. Also new is a video tour hosted by NASA Jet Propulsion Laboratory’s Amber Jenkins, who introduces many of the site’s in-depth features and capabilities. Users can:
  • Fly along with a satellite as it sweeps the Earth below in accelerated time.
  • Compare the size of each spacecraft to a car or a scientist.
  • Blast through a global carbon dioxide map to uncover some of the world's most populous and polluting cities in the interactive game, "Metropolis."
Click here to launch “Eyes on the Earth 3D” in your web browser.

NASA Researcher Nets First Measure of Africa's Coastal Forests

NASA researcher Lola Fatoyinbo (left), seen here in June 2005 on the site where she conducted some of her field measurementsImpoverished fishermen along the coast of tropical African countries like Mozambique and Madagascar may have only a few more years to eke out a profit from one of their nations’ biggest agricultural exports. Within a few decades, they may no longer have a livelihood at all.

That's because swampy mangrove forests – essential breeding grounds for fish and shellfish in these countries – are being destroyed by worsening pollution, encroaching real estate development, and deforestation necessary to sustain large-scale commercial shrimp farming.

The decline of these forests threatens much of Africa’s coastal food supply and economy. The destruction of mangroves -- one of Earth’s richest natural resources – also has implications for everything from climate change to biodiversity to the quality of life on Earth. Growing up in Cotonou, Benin, environmental scientist Lola Fatoyinbo of NASA’s Jet Propulsion Laboratory (JPL) passed polluted mangroves daily. Inspired to help save the forests, she began a mission as a graduate student in the United States to gain more insight about African mangroves.

Her studies have brought her back to Africa, where she has journeyed along the coastlines to test a new satellite technique for measuring the area, height, and biomass of mangrove forests. She developed and employed a method that can be used across the continent, overcoming expensive, ad hoc, and inconsistent modes of ground-based measurement. Fatoyinbo’s approach recently produced what she believes is the first full assessment of the continent’s mangrove forests.

“We’ve lost more than 50 percent of the world’s mangrove forests in a little over half a century; a third of them have disappeared in the last 20 years alone," said Fatoyinbo, whose earlier study of Mozambique’s coastal forests laid the groundwork for the continent-wide study. "Hopefully this technique will offer scientists and officials a method of estimating change in this special type of forest.”

An Ecosystem Apart

Mangroves are the most common ecosystem in coastal areas of the tropics and sub-tropics. The swampy forests are essential -- especially in densely-populated developing countries -- for rice farming, fishing and aquaculture (freshwater and saltwater farming), timber, and firewood. Some governments also increasingly depend on them for eco-tourism.

The large, dense root systems are a natural obstacle that helps protect shorelines against debris and erosion. Mangroves are often the first line of defense against severe storms, tempering the impact of strong winds and floods.

These coastal woodlands also have a direct link to climate, sequestering carbon from the atmosphere at a rate of about 100 pounds per acre per day – comparable to the per acre intake by tropical rainforests (though rainforests cover more of Earth’s surface).

“To my knowledge, this study is the first complete mapping of Africa’s mangroves, a comprehensive, historic baseline enabling us to truly begin monitoring the welfare of these forests,” said Assaf Anyamba, a University of Maryland-Baltimore County expert on vegetation mapping, based at NASA’s Goddard Space Flight Center in Greenbelt, Md.

Climbing the Right Tree

Fatoyinbo’s research combines multiple satellite observations of tree height and land cover, mathematical formulas, and “ground-truthing” data from the field to measure the full expanse and makeup of the coastal forests.

Her measurements yielded three new kinds of maps of mangroves: continental maps of how much land the mangroves cover; a three-dimensional map of the height of forest canopies across the continent; and biomass maps that allow researchers to assess how much carbon the forests store.

“Beyond density or geographical size of the forests, the measurements get to the heart of the structure, or type, of mangroves," explained Fatoyinbo. "It’s that trait – forest type – that drives which forests land managers target for agriculture, conservation, and habitat suitability for animals and people.”

Fatoyinbo's height map of Gabon's mangrove forest canopy, left image, indicates heights ranging from 0 to 40 meters. In the right image, Fatoyinbo used Google Earth software to overlay the same three dimensional height map of Gabon's mangroves.
> View larger image

Fatoyinbo’s height map of Gabon’s mangrove forest canopy (left image) indicates heights ranging from 0 to 40 meters. In the right image, Fatoyinbo used Google Earth software to overlay the same three-dimensional height map of Gabon’s mangroves.

Fatoyinbo and colleague Marc Simard of JPL used satellite images from the NASA-built Landsat and a complex software-based color classification system to distinguish areas of coastal forests from other types of forests, urban areas or agricultural fields. They also integrated data from NASA’s Shuttle Radar Topography Mission (SRTM) to create relief maps of the height of the forest canopy. Finally, they merged the broad radar maps with high-accuracy observations from a light detection and ranging (commonly called lidar) instrument aboard NASA’s Ice, Cloud, and land Elevation Satellite (ICESat) to obtain accurate height estimates.

Fatoyinbo double-checked the accuracy of her satellite measurements at the ground level in the only way possible: She went to Africa to measure tree heights and trunk diameters in person. Using a hand-held instrument called a clinometer and a simple trigonometry formula, Fatoyinbo visited Mozambique, measured the trees, and found she indeed had very accurate measurements of the forests.

Preserving the Forest for the Trees

Mangroves are hardy and adaptable forests that can thrive under extreme heat, very high salt levels, and swampy soil. Rampant clearing for agriculture and construction, soil toxicity, and long-term oil and sewage pollution, however, are increasingly threatening their survival and more than 1,300 animal species in ways that nature cannot.

“The United States’ largest mangrove forests, Florida’s Everglades, are largely protected now and recognized as an endangered natural resource,” explained Fatoyinbo. “But in many other places, resource managers lack solid monitoring capabilities to counter mangrove exploitation. Better mangrove monitoring will, I hope, mean better management and preservation.”

Free satellite data can help ease the problems of money, logistics, and political instability that can prevent mangrove preservation. For that reason, Anyamba and Fatoyinbo are working to convince the United Nations Environment Program and the UN Educational, Scientific and Cultural Organization to include the study’s data in their environmental assessments.

The new technique also distinguishes itself, added Anyamba, “as an excellent example of how we can use different remote sensing technologies together to address science questions and global social issues.”

Related Links:

> Fatoyinbo’s original study on mangrove measurements in Mozambique, Journal of Geophysical Research
> More about NASA’s Lola Fatoyinbo
> Scientists Find Climate Change to Have Paradoxical Effects on Coastal Wetlands
> Rice Farming in Mangroves, Guinea-Bissau
> Mangroves Along Bombetoka Bay, Madagascar
> NASA’s Shuttle Radar Topography Mission
> NASA’s ICESat Mission

Chandra's Top 10 Scientific Contributions

To see 100 of Chandra's "Greatest Hits" from the past 10 years, check out the slideshow below:


NASA's Chandra X-ray Observatory is celebrating 10 years of exploring the invisible universe. On Aug. 19, 1999, Chandra captured its first image as an astronomical observatory. This first light image opened a new era for science as Chandra began its mission to open a mysterious universe.

Chandra enables scientists from around the world to obtain unprecedented X-ray images of exotic environments to help understand the evolution of the cosmos. The observatory not only helps to probe these mysteries, but also serves as a unique tool to study detailed physics in a laboratory that cannot be replicated on Earth.

Distant galaxy 3C294, observed by Chandra on February 15, 2001"Chandra has changed the whole understanding of dark matter and increased our knowledge of dark energy, as well as gathered new information on black holes," said Dr. Martin Weisskopf, Chandra project scientist at the Marshall Space Flight Center.

"Chandra has produced 10,000 observations in its 10-year life and the demand for observation time, by scientists, is five- to six-times what is available," said Chandra Program Manager Keith Hefner of the Marshall Center. "It continues to be an engineering marvel that has more than doubled its original five-year mission."

Artist concept of supernova SN 2006gy, viewed by Chandra on May 7, 2007A Chandra "Top 10" reveals some of the most noteworthy discoveries:
  1. Chandra finds a ring around the Crab Nebula. After only two months in space, the observatory reveals a brilliant ring around the heart of the Crab Pulsar in the Crab Nebula -- the remains of a stellar explosion -- providing clues about how the nebula is energized by a pulsing neutron, or collapsed star. (Sept. 28, 1999)
  2. Chandra finds the most distant X-ray cluster. Using the Chandra Observatory, astronomers find the most distant X-ray cluster of galaxies yet. Approximately 10 billion light years from Earth, the cluster 3C294 is 40 percent farther than the next most distant X-ray galaxy cluster. (Feb. 15, 2001)
  3. Chandra makes deepest X-ray exposure. A Chandra image, Deep Field North, captures for 23 days an area of the sky one-fifth the size of the full moon. Even though the faintest sources detected produced only one X-ray photon every four days, Chandra finds more than 600 X-ray sources, most of them super massive black holes in galaxy centers. (June 19, 2003)
  4. Chandra hears a black hole. Using the Chandra observatory, astronomers for the first time detected sound waves from a super massive black hole. Coming from a black hole 250 million light years from Earth, the "note" is the deepest ever detected from an object in the universe. (Sept. 9, 2003)
  5. Chandra opens a new line of investigation on dark energy. Using galaxy-cluster images from Chandra, astronomers apply a powerful, new method for detecting and probing dark energy. The results offer intriguing clues about the nature of dark energy and the fate of the universe. (May 18, 2004)
  6. Composite of galaxy cluster 1E 0657-56, a Chandra image from on August 21, 2006
  7. Chandra finds that Saturn reflects X-rays from the sun. The findings stem from the first observation of an X-ray flare reflected from Saturn's low-latitudes -- the region that correlates to Earth's equator and tropics. (May 25, 2005)
  8. Chandra finds proof of dark matter. In galaxy clusters, the normal matter, like the atoms that make up the stars, planets, and everything on Earth, is primarily in the form of hot gas and stars. The mass of the hot gas between the galaxies is far greater than the mass of the stars in all of the galaxies. This normal matter is bound in the cluster by the gravity of an even greater mass of dark matter. Without dark matter, which is invisible and can only be detected through its gravity, the fast-moving galaxies and the hot gas would quickly fly apart. (Aug. 21, 2006)
  9. Chandra sees brightest supernova ever. The brightest stellar explosion ever recorded may be a long-sought new type of supernova, according to observations by NASA's Chandra X-ray Observatory and ground-based optical telescopes. The Crab Nebula, seen by Chandra on September 28, 1999This discovery indicates that violent explosions of extremely massive stars were relatively common in the early universe, and that a similar explosion may be ready to go off in our own galaxy. (May 7, 2007)
  10. Chandra finds a new way to weigh black holes. By measuring a peak in the temperature of hot gas in the center of the giant elliptical galaxy NGC 4649, scientists have determined the mass of the galaxy's super massive black hole. The method, applied for the first time, gives results that are consistent with a traditional technique. (July 16, 2008)
  11. Long observation from Chandra identified the source of this energy for blobs. The X-ray data show that a significant source of power within these colossal structures is from growing super massive black holes partially obscured by dense layers of dust and gas. The fireworks of star formation in galaxies are also seen to play an important role, thanks to Spitzer Space Telescope and ground-based observations. (June 24, 2009)
The Marshall Center manages the Chandra program for the Science and Mission Directorate, NASA Headquarters, Washington. Northrop Grumman of Redondo Beach, Calif., formerly TRW Inc., was the prime development contractor for the observatory. The Smithsonian Astrophysical Observatory controls science and flight operations from the Chandra X-ray Center in Cambridge, Mass.

For more information visit:

http://www.nasa.gov/chandra

Galaxies Demand a Stellar Recount

Diagram illustrating the proportion of small to big stars in certain galaxies.
For decades, astronomers have gone about their business of studying the cosmos with the assumption that stars of certain sizes form in certain quantities. Like grocery stores selling melons alone, and blueberries in bags of dozens or more, the universe was thought to create stars in specific bundles. In other words, the proportion of small to big stars was thought to be fixed. For every star 20 or more times as massive as the sun, for example, there should be 500 stars with the sun's mass or less.

This belief, based on years of research, has been tipped on its side with new data from NASA's Galaxy Evolution Explorer. The ultraviolet telescope has found proof that small stars come in even bigger bundles than previously believed; for example, in some places in the cosmos, about 2,000 low-mass stars may form for each massive star. The little stars were there all along but masked by massive, brighter stars.

"What this paper is showing is that some of the standard assumptions that we've had - that the brightest stars tell you about the whole population of stars - this doesn't seem to work, at least not in a constant way," said Gerhardt R. Meurer, principal investigator on the study and a research scientist at Johns Hopkins University, Baltimore, Md.

Astronomers have long known that many stars are too dim to be seen in the glare of their brighter, more massive counterparts. Though the smaller, lighter stars outnumber the big ones, they are harder to see. Going back to a grocery story analogy, the melons grab your eyes, even though the total weight of the blueberries may be more.

Beginning in the 1950s, astronomers came up with a method for counting all the stars in a region, even the ones they couldn't detect. They devised a sort of stellar budget, an equation called the "stellar initial mass function," to estimate the total number of stars in an area of the sky based on the light from only the brightest and most massive. For every large star formed, a set number of smaller ones were thought to have been created regardless of where the stars sat in the universe.

"We tried to understand properties of galaxies and their mass by looking at the light we can see," Meurer said.

But this common assumption has been leading astronomers astray, said Meurer, especially in galaxies that are intrinsically small and faint.

To understand the problem, imagine trying to estimate the population on Earth by observing light emitted at night. Looking from above toward North America or Europe, the regions where more people live light up like signposts. Los Angeles, for example, is easily visible to a scientist working on the International Space Station. However, if this method were applied to regions where people have limited electricity, populations would be starkly underestimated, for example in some sections of Africa.

Images from NASA's Galaxy Evolution Explorer spacecraft and the Cerro Tololo International Observatory.
The same can be said of galaxies, whose speckles of light in the dark of space can be misleading. Meurer and his team used ultraviolet images from the Galaxy Evolution Explorer and carefully filtered red-light images from telescopes at the Cerro Tololo Inter-American Observatory in Chile to show that many galaxies do not form a lot of massive stars, yet still have plenty of lower-mass counterparts. The ultraviolet images are sensitive to somewhat small stars three times or more massive than the sun, while the filtered optical images are only sensitive to the largest stars with 20 or more times the mass of the sun.

The effects are particularly important in parts of the universe where stars are spread out over a larger volume -- the rural Africa of the cosmos. There could be about four times as many stars in these regions than previously estimated.

"Especially in these galaxies that seem small and piddling, there can be a lot more mass in lower mass stars than we had previously expected from what we could see from the brightest, youngest stars," Meurer said. "But we can now reduce these errors using satellites like the Galaxy Evolution Explorer."

The Ultimate Long Distance Communication

This image shows cratered regions near the moon's Mare Nubium regionThis image shows cratered regions near the moon's Mare Nubium regionAnyone who's vacationed in the mountains or lived on a farm knows that it's hard to get good internet access or a strong cell phone signal in a remote area. Communicating across great distances has always been a challenge. So when NASA engineers designed the Lunar Reconnaissance Orbiter (LRO), they knew it would need an extraordinary communications system.

Over the next year, the LRO, NASA's diligent robotic scout, will collect more information about the moon's surface and environment than any previous mission. It takes a powerful system to send all of this information more than 238,800 miles back to Earth.

A 13-inch-long tube, called a Traveling Wave Tube Amplifier, is making it possible for scientists to receive massive amounts of images and data from the orbiter at an unusually fast rate. It is the first high data rate K-band transmitter to fly on a NASA spacecraft.

With this new amplifier, LRO can transmit 461 gigabytes of data per day. That's more information than you can find in a four-story library. And it transmits this information at a rate of up to 100 megabytes per second. By comparison, typical high-speed internet service provides about 1 to 3 megabytes per second.

L-3 Communications Electron Technologies built the amplifier under the supervision of NASA's Glenn Research Center in Cleveland. The device uses electrodes in a vacuum tube to amplify microwave signals to high power. It's ideal for sending large amounts of data over a long distance because it provides more power and more efficiency than its alternative, the transistor amplifier.

As the orbiter collects information about the moon's geography, climate and environment, the communication system transmits this information to a receiver at a Ka band antenna network at White Sands Test Facility in New Mexico. Scientists are using the data to compile high-resolution, 3D maps of the lunar surface.

"We're sending back more data than ever, faster and it's nearly real time," said Glenn project manager Todd Peterson.

Traveling Wave Tube Amplifiers have been used for other planetary missions, such as Kepler and Cassini, but previous designs were less powerful. According to Rainee Simons, chief of Glenn's Electron and Optoelectronic Device Branch, engineers had to redesign the internal circuitry of the amplifier.

"In order to provide the power and frequency needed to send communications from the vicinity of the moon, it had to be custom designed and handmade," he said.

The orbiter's Traveling Wave Tube Amplifier is also more efficient than previous amplifiers. When it comes to launching satellites, weight means money. The heavier the spacecraft, the more fuel it needs to reach orbit. Because the new amplifier packs more power into a lighter design than previous microwave amplifiers, it's cheaper to fly.

The amplifier underwent vigorous spaceflight testing -- including vibration, thermal vacuum, radiation and electromagnetic interference tests -- to ensure that it could withstand the intense conditions of launch and lunar orbit.

Simons, Peterson and other members of the Glenn team were on standby when LRO entered its final orbit and began transmitting data. They were thrilled to hear that it's working properly, not only because LRO is a vital step toward returning humans to the moon, but also because they believe the new amplifier can improve life on Earth in countless ways.

If used on communication satellites, it could allow for much better tracking, monitoring and control of transoceanic flights and ships traveling beyond the reach of radar.

It also could enable real-time data transfer from future Earth-orbiting satellites. Such satellites are used to track migratory animals, endangered species, icebergs, volcanic eruptions and forest fires, and to aid in search and rescue operations. They're used to study climate change and meteorology as well.

According to Simons, by collecting more timely data about the interaction of our atmosphere, ocean and land, we could save lives and property during severe weather.

"This technology has the potential to create a better world," he said.

NASA Research Reveals Major Insight Into Evolution of Life on Earth

Humans might not be walking on Earth today if not for the ancient fusing of two microscopic, single-celled organisms called prokaryotes, NASA-funded research has found.

By comparing proteins present in more than 3000 different prokaryotes - a type of single-celled organism without a nucleus -- molecular biologist James A. Lake from the University of California at Los Angeles' Center for Astrobiology showed that two major classes of relatively simple microbes fused together more than 2.5 billion years ago. Lake's research reveals a new pathway for the evolution of life on Earth. These insights are published in the Aug. 20 online edition of the journal Nature.

Molecular biologist James A. Lake from the University of California at Los Angeles Center for Astrobiology.This endosymbiosis, or merging of two cells, enabled the evolution of a highly stable and successful organism with the capacity to use energy from sunlight via photosynthesis. Further evolution led to photosynthetic organisms producing oxygen as a byproduct. The resulting oxygenation of Earth's atmosphere profoundly affected the evolution of life, leading to more complex organisms that consumed oxygen, which were the ancestors of modern oxygen-breathing creatures including humans.

"Higher life would not have happened without this event," Lake said. "These are very important organisms. At the time these two early prokaryotes were evolving, there was no oxygen in the Earth's atmosphere. Humans could not live. No oxygen-breathing organisms could live."

The genetic machinery and structural organization of these two organisms merged to produce a new class of prokaryotes, called double membrane prokaryotes. As they evolved, members of this double membrane class, called cyanobacteria, became the primary oxygen-producers on the planet, generating enough oxygen to alter the chemical composition of the atmosphere and set the stage for the evolution of more complex organisms such as animals and plants.

"This work is a major advance in our understanding of how a group of organisms came to be that learned to harness the sun and then effected the greatest environmental change Earth has ever seen, in this case with beneficial results," said Carl Pilcher, director of the NASA Astrobiology Institute at NASA's Ames Research Center in Moffett Field, Calif., which co-funded the study with the National Science Foundation in Arlington, Va.

Founded in 1998, the NASA Astrobiology Institute is a partnership between NASA, 14 U.S. teams and six international consortia. The institute's goals are to promote, conduct, and lead interdisciplinary astrobiology research; train a new generation of astrobiology researchers; and share the excitement of astrobiology with learners of all ages.

The institute is part of NASA's Astrobiology Program in Washington. The program supports research into the origin, evolution, distribution and future of life on Earth and the potential for life elsewhere.

For more information about the NASA's Astrobiology Program and the institute, visit: http://astrobiology.nasa.gov.

South African teen wins 800 amid gender-test flap

Facing questions about her gender, South African teenager Caster Semenya easily won the 800-meter gold medal Wednesday at the world championships.

Her dominating run came on the same day track and field’s ruling body said she was undergoing a gender test because of concerns she does not meet requirements to compete as a woman.

Semenya took the lead at the halfway mark and opened a commanding lead in the last 400 meters to win by a massive 2.45 seconds in a world-leading 1 minute, 55.45 seconds. Defending champion Janeth Jepkosgei was second and Jennifer Meadows of Britain was third in 1:57.93.

After crossing the line, Semenya dusted her shoulders with her hands. Semenya did not speak to reporters after the race or attend a news conference.

About three weeks ago, the international federation asked South African track and field authorities to conduct the verification test. Semenya had burst onto the scene by posting a world-leading time of 1:56.72 at the African junior championships in Maruitius.

Her dramatic improvement in times, muscular build and deep voice sparked speculation about her gender. Ideally, any dispute surrounding an athlete is dealt with before a major competition. But Semenya’s stunning rise from unknown teenage runner to the favorite in the 800 happened almost overnight. That meant the gender test—which takes several weeks—could not be completed in time.

Before the race, IAAF spokesman Nick Davies stressed this is a “medical issue, not an issue of cheating.” He said the “extremely complex” testing has begun. The process requires a physical medical evaluation and includes reports from a gynecologist, endocrinologist, psychologist, internal medicine specialist and gender expert.

South Africa team manager Phiwe Mlangeni-Tsholetsane would not confirm or deny that Semenya was having such a test.

“We entered Caster as a woman and we want to keep it that way,” Mlangeni-Tsholetsane said. “Our conscience is clear in terms of Caster. We have no reservations at all about that.”

Although medals will be awarded for the 800, the race remains under a cloud until the investigation is closed, and Semenya could be stripped of the gold depending on the test results, IAAF general secretary Pierre Weiss said.

“But today there is no proof and the benefit of doubt must always be in favor of the athlete,” Weiss said.

Semenya’s rivals said they tried not to dwell on the issue before the race.

“I’ve heard a lot of speculation, but all I could do was just keep a level head and go about my business,” Meadows said. “If none of it’s true, I feel very sorry for her.”

One thing not in doubt was Semenya’s outstanding run.

“Nobody else in the world can do that sort of time at the moment,” Meadows said. “She obviously took the race by storm.”